Consider the following integral. Sketch its region of integration in the xy-plane. 0 If (a) Which graph shows the region of integration in the xy-plane? A (b) Evaluate the integral. √16-22 6xy dy dx 3₁ --1 -2 A (Click on a graph to enlarge it) B
Consider the following integral. Sketch its region of integration in the xy-plane. 0 If (a) Which graph shows the region of integration in the xy-plane? A (b) Evaluate the integral. √16-22 6xy dy dx 3₁ --1 -2 A (Click on a graph to enlarge it) B

Advanced Engineering Mathematics
10th Edition
ISBN:9780470458365
Author:Erwin Kreyszig
Publisher:Erwin Kreyszig
Chapter2: Second-order Linear Odes
Section: Chapter Questions
Problem 1RQ

Related questions
Question
100%
![### Understanding the Integral and Its Region of Integration
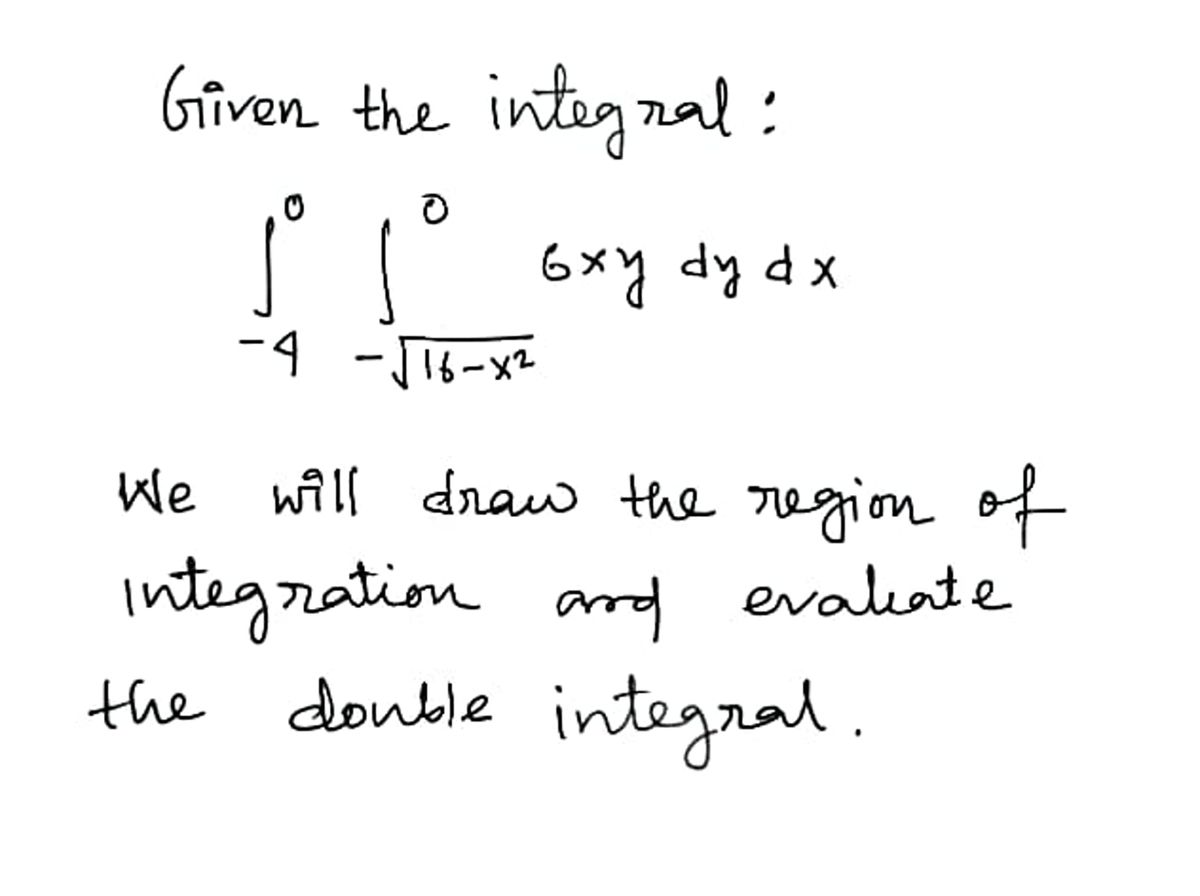
Consider the following integral. Sketch its region of integration in the xy-plane.
\[
\int_{-4}^{0} \int_{-\sqrt{16-x^2}}^{0} 6xy \, dy \, dx
\]
#### Tasks:
(a) Identify which graph shows the region of integration in the xy-plane.
(b) Evaluate the integral.
### Explanation of the Graphs
The page displays four quadrants labeled A, B, C, and D, each showing a shaded region representing possible areas of integration:
- **Graph A**:
- Contains a shaded quarter-circle centered at the origin, covering part of the 3rd quadrant.
- Bounded by \(x = -4\), \(y = 0\), and the curve \(x^2 + y^2 = 16\) in the negative \(x\) and \(y\) directions.
- **Graph B**:
- Contains a shaded quarter-circle centered at the origin, covering part of the 2nd quadrant.
- Unrelated to the given limits of integration.
- **Graph C**:
- Contains a shaded quarter-circle centered at the origin, covering part of the 4th quadrant.
- Unrelated to the given limits of integration.
- **Graph D**:
- Contains a shaded quarter-circle centered at the origin, covering part of the 1st quadrant.
- Unrelated to the given limits of integration.
**Evaluation:**
- **Correct Graph**: Graph A correctly represents the region of integration, covering the negative \(x\) and \(y\) limits as specified by the integral.
- **Integration**: Calculating the integral involves integrating the function \(6xy\) over the described region.
**Interactive Element**: Users can click on a graph to enlarge it for a better view.
**Note**: This visualization aids students in understanding how integral limits describe regions in the plane and how these are reflected graphically.](/v2/_next/image?url=https%3A%2F%2Fcontent.bartleby.com%2Fqna-images%2Fquestion%2F814c1a84-19e4-4bdf-9de9-08c645d411b5%2F7c3f7f33-4dd1-4809-8d71-0fae4af7e27f%2F046rfbg_processed.png&w=3840&q=75)
Transcribed Image Text:### Understanding the Integral and Its Region of Integration
Consider the following integral. Sketch its region of integration in the xy-plane.
\[
\int_{-4}^{0} \int_{-\sqrt{16-x^2}}^{0} 6xy \, dy \, dx
\]
#### Tasks:
(a) Identify which graph shows the region of integration in the xy-plane.
(b) Evaluate the integral.
### Explanation of the Graphs
The page displays four quadrants labeled A, B, C, and D, each showing a shaded region representing possible areas of integration:
- **Graph A**:
- Contains a shaded quarter-circle centered at the origin, covering part of the 3rd quadrant.
- Bounded by \(x = -4\), \(y = 0\), and the curve \(x^2 + y^2 = 16\) in the negative \(x\) and \(y\) directions.
- **Graph B**:
- Contains a shaded quarter-circle centered at the origin, covering part of the 2nd quadrant.
- Unrelated to the given limits of integration.
- **Graph C**:
- Contains a shaded quarter-circle centered at the origin, covering part of the 4th quadrant.
- Unrelated to the given limits of integration.
- **Graph D**:
- Contains a shaded quarter-circle centered at the origin, covering part of the 1st quadrant.
- Unrelated to the given limits of integration.
**Evaluation:**
- **Correct Graph**: Graph A correctly represents the region of integration, covering the negative \(x\) and \(y\) limits as specified by the integral.
- **Integration**: Calculating the integral involves integrating the function \(6xy\) over the described region.
**Interactive Element**: Users can click on a graph to enlarge it for a better view.
**Note**: This visualization aids students in understanding how integral limits describe regions in the plane and how these are reflected graphically.
Expert Solution
Step 1: Write the given integral

Step by step
Solved in 4 steps with 4 images

Recommended textbooks for you
Advanced Engineering Mathematics
Advanced Math
ISBN:
9780470458365
Author:
Erwin Kreyszig
Publisher:
Wiley, John & Sons, Incorporated

Numerical Methods for Engineers
Advanced Math
ISBN:
9780073397924
Author:
Steven C. Chapra Dr., Raymond P. Canale
Publisher:
McGraw-Hill Education

Introductory Mathematics for Engineering Applicat…
Advanced Math
ISBN:
9781118141809
Author:
Nathan Klingbeil
Publisher:
WILEY
Advanced Engineering Mathematics
Advanced Math
ISBN:
9780470458365
Author:
Erwin Kreyszig
Publisher:
Wiley, John & Sons, Incorporated
Numerical Methods for Engineers
Advanced Math
ISBN:
9780073397924
Author:
Steven C. Chapra Dr., Raymond P. Canale
Publisher:
McGraw-Hill Education
Introductory Mathematics for Engineering Applicat…
Advanced Math
ISBN:
9781118141809
Author:
Nathan Klingbeil
Publisher:
WILEY

Mathematics For Machine Technology
Advanced Math
ISBN:
9781337798310
Author:
Peterson, John.
Publisher:
Cengage Learning,

