Consider the data below: 17, 11, 10, 13, 1, 6, 18, 21, 8, 5 Compute the variance Compute the
Consider the data below: 17, 11, 10, 13, 1, 6, 18, 21, 8, 5 Compute the variance Compute the

A First Course in Probability (10th Edition)
10th Edition
ISBN:9780134753119
Author:Sheldon Ross
Publisher:Sheldon Ross
Chapter1: Combinatorial Analysis
Section: Chapter Questions
Problem 1.1P: a. How many different 7-place license plates are possible if the first 2 places are for letters and...

Related questions
Question
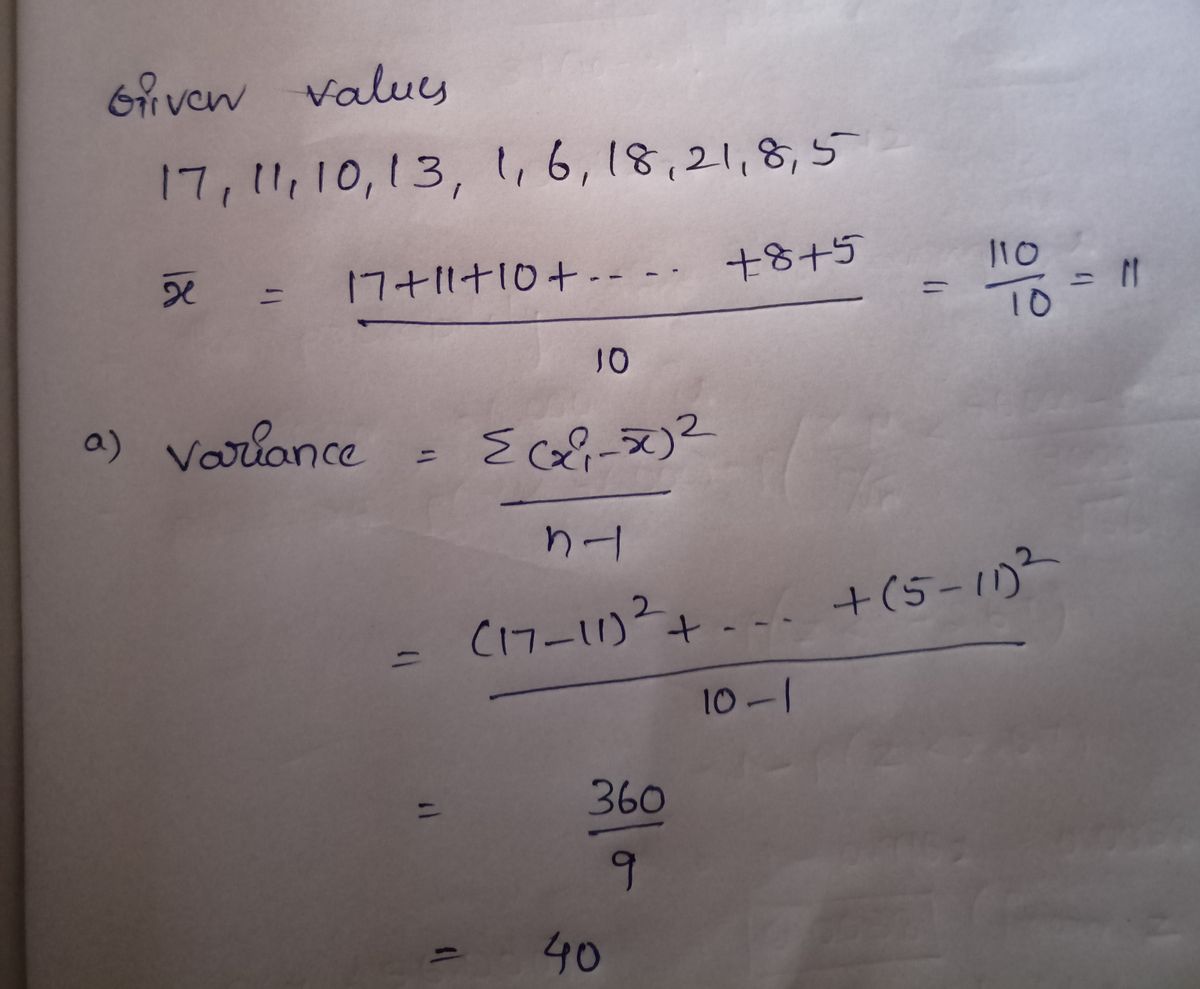
Consider the data below:
17, 11, 10, 13, 1, 6, 18, 21, 8, 5
- Compute the variance
- Compute the standard deviation
- Compute the coefficient of variation
Expert Solution
Step 1

Step by step
Solved in 2 steps with 2 images

Recommended textbooks for you
A First Course in Probability (10th Edition)
Probability
ISBN:
9780134753119
Author:
Sheldon Ross
Publisher:
PEARSON

A First Course in Probability (10th Edition)
Probability
ISBN:
9780134753119
Author:
Sheldon Ross
Publisher:
PEARSON