Chemistry 10th Edition
ISBN: 9781305957404
Author: Steven S. Zumdahl, Susan A. Zumdahl, Donald J. DeCoste
Publisher: Steven S. Zumdahl, Susan A. Zumdahl, Donald J. DeCoste
1 Chemical Foundations 2 Atoms, Molecules, And Ions 3 Stoichiometry 4 Types Of Chemical Reactions And Solution Stoichiometry 5 Gases 6 Thermochemistry 7 Atomic Structure And Periodicity 8 Bonding: General Concepts 9 Covalent Bonding: Orbitals 10 Liquids And Solids 11 Properties Of Solutions 12 Chemical Kinetics 13 Chemical Equilibrium 14 Acids And Bases 15 Acid-base Equilibria 16 Solubility And Complex Ion Equilibria 17 Spontaneity, Entropy, And Free Energy 18 Electrochemistry 19 The Nucleus: A Chemist's View 20 The Representative Elements 21 Transition Metals And Coordination Chemistry 22 Organic And Biological Molecules Chapter1: Chemical Foundations
Chapter Questions Section: Chapter Questions
Problem 1RQ: Define and explain the differences between the following terms. a. law and theory b. theory and... Problem 2RQ: Is the scientific method suitable for solving problems only in the sciences? Explain. Problem 3RQ: Which of the following statements could be tested by quantitative measurement? a. Ty Cobb was a... Problem 4RQ: For each of the following pieces of glassware, provide sample measurement and discuss the number of... Problem 5RQ: A student performed an analysis of a sample for its calcium content and got the following results:... Problem 6RQ: Compare and contrast the multiplication/division significant figure rule to the significant figure... Problem 7RQ: Explain how density can be used as a conversion factor to convert the volume of an object to the... Problem 8RQ: On which temperature scale (F, C. or K) docs 1 degree represent the smallest change in temperature? Problem 9RQ: Distinguish between physical changes and chemical changes. Problem 10RQ: Why is the separation of mixtures into pure or relatively pure substances so important when... Problem 1ALQ: a. There are 365 days per year, 24 hours per day, 12 months per year, and 60 minutes per hour. Use... Problem 2ALQ Problem 3ALQ: When a marble is dropped into a beaker of water, it sinks to the bottom. Which of the following is... Problem 4ALQ Problem 5ALQ: You may have noticed that when water boils, you can see bubbles that rise to the surface of the... Problem 6ALQ: If you place a glass rod over a burning candle, the glass appears to turn black. What is happening... Problem 7ALQ: Which characteristics of a solid, a liquid, and a gas are exhibited by each of the following... Problem 8ALQ: Sketch a magnified view (showing atoms/molecules) of each of the following and explain: a. a... Problem 9ALQ: Paracelsus, a sixteenth-century alchemist and healer, adopted as his slogan: "The patients are your... Problem 10ALQ: What is wrong with the following statement? "The results of the experiment do not agree with the... Problem 11ALQ: Why is it incorrect to say that the results of a measurement were accurate but not precise? Problem 14ALQ: You have a 1.0-cm3 sample of lead and a 1.0-cm3 sample of glass. You drop each in separate beakers... Problem 15ALQ: Consider the addition of 15.4 to 28. What would a mathematician say the answer is? What would a... Problem 16ALQ: Consider multiplying 26.2 by 16.43. What would a mathematician say the answer is? What would a... Problem 17ALQ: True or false? For mathematical operation performed on two measurements, the number of significant... Problem 18ALQ: Is there a difference between a homogeneous mixture of hydrogen and oxygen in a 2:1 ratio and a... Problem 19Q: The difference between a law and a theory is the difference between what and why. Explain. Problem 20Q: The scientific method is a dynamic process. What does this mean? Problem 21Q: Explain the fundamental steps of the scientific method. Problem 22Q Problem 23Q: A measurement is a quantitative observation involving both a number and a unit. What is a... Problem 24Q: To determine the volume of a cube, a student measured one of the dimensions of the cube several... Problem 25Q: What are significant figures? Show how to indicate the number one thousand to 1 significant figure,... Problem 26Q: A cold front moves through and the temperature drops by 20 degrees. In which temperature scale would... Problem 28Q: In a multiple-step calculation, is it better to round off the numbers to the correct number of... Problem 29Q: Is the density of a gaseous substance larger or smaller than the density of a liquid or a solid at... Problem 30Q: Give four examples illustrating each of the following terms. a. homogeneous mixture b. heterogeneous... Problem 31E: Which of the following are exact numbers? a. There are 100 cm in 1 m. b. One meter equals 1.094... Problem 32E: Indicate the number of significant figures in each of the following: a. This book contains more than... Problem 33E: How many significant figures are there in each of die following values? a. 6.07 1015 b. 0.003840 c.... Problem 34E: How many significant figures are in each of the following? a. 100 b. 102 c. 103 d. 100. e. 0.0048... Problem 35E: Round off each of the following numbers to the indicated number of significant digits, and write the... Problem 36E: Use exponential notation to express the number 385,500 to a. one significant figure. b. two... Problem 37E: You have liquid in each graduated cylinder shown: You then add both samples to a beaker. How would... Problem 38E: The beakers shown below have different precisions. a. Label the amount of water in each of the three... Problem 39E: Evaluate each of the following, and write the answer to the appropriate number of significant... Problem 40E: Perform the following mathematical operations, and express each result to the correct number of... Problem 41E: Perform the following mathematical operations, and express the result to the correct number of... Problem 42E: Perform the following mathematical operations, and express the result to the correct number of... Problem 43E: Perform each of the following conversions. a. 8.43 cm to millimeters b. 2.41 102 cm to meters c.... Problem 44E: a. How many kilograms are in 1 teragram? b. How many nanometers are in 6.50 x 10² terameters? c. How... Problem 45E: Perform the following unit conversions. a. Congratulations! You and your spouse are the proud... Problem 46E: Perform the following unit conversions. a. 908 oz to kilograms b. 12.8 L to gallons c. 125 mL to... Problem 47E: Use the following exact conversion factors to perform the stated calculations: 512 yd -= 1 rod 40... Problem 48E: Although the preferred SI unit of area is the square meter, land is often measured in the metric... Problem 49E: Precious metals and gems are measured in troy weights in the English system: 24 grains 1 pennyweight... Problem 50E: Apothecaries (druggists) use the following set of measures in the English system: 20 grains ap = 1... Problem 51E: For a pharmacist dispensing pills or capsules, it is often easier to weigh the medication to be... Problem 52E: A children's pain relief elixir contains 80. mg acetaminophen per 0.50 teaspoon. The dosage... Problem 53E: Science fiction often uses nautical analogies to describe space travel. If the starship U.S.S.... Problem 54E: The world record for the hundred meter dash is 9.58 s. What is the corresponding average speed in... Problem 55E: You are driving 65 mi/h and take your eyes off the road for just a second. What distance (in feet)... Problem 56E: You pass a road sign saying New York 112 km. If you drive at a constant speed of 65 mi/h, how long... Problem 57E: The dosage for an antibiotic is prescribed at 8.0 mg per kilo-gram of body weight, taken twice daily... Problem 58E: In recent years, there has been a large push for an increase in the use of renewable resources to... Problem 59E Problem 60E: Carbon monoxide (CO) detectors sound an alarm when peak levels of carbon monoxide reach 100 parts... Problem 61E: Convert the following Fahrenheit temperatures to the Celsius and Kelvin scales. a. 459F, an... Problem 62E: A thermometer gives a reading of 96.1F 0.2F. What is the temperature in C? What is the uncertainty? Problem 63E: Convert the following Celsius temperatures to Kelvin and to Fahrenheit degrees. a. the temperature... Problem 64E: Convert the following Kelvin temperatures to Celsius and Fahrenheit degrees. a. the temperature that... Problem 65E: At what temperature is the temperature in degrees Fahrenheit equal to twice the temperature in... Problem 66E: The average daytime temperatures on the earth and Jupiter are 72F and 313 K, respectively. Calculate... Problem 67E: Use the figure below to answer the following questions. a. Derive the relationship between C and X.... Problem 68E: Ethylene glycol is the main component in automobile anti-freeze. To monitor the temperature of an... Problem 69E: A material will float on the surface of a liquid if the material has a density less than that of the... Problem 70E: One metal object is a cube with edges of 3.00 cm and a mass of 140.4 g. A second metal object is a... Problem 71E: A star is estimated to have a mass of 2 1036 kg. Assuming it to be a sphere of average radius 7.0 ... Problem 72E: A rectangular block has dimensions 2.9 cm 3.5 cm 10.0 cm. The mass of the block is 615.0 g. What... Problem 73E: Diamonds are measured in carats, and 1 carat = 0.200 g. The density of diamond is 3.51 g/cm3. a.... Problem 74E: At room temperature the element bromine, Br2, is a liquid with a density of 3.12 g/cm3. Calculate... Problem 75E: A sample containing 33.42 g of metal pellets is poured into a graduated cylinder initially... Problem 76E: The density of pure silver is 10.5 g/cm3 at 20C. If 5.25 g of pure silver pellets is added to a... Problem 77E: In e-ach of the following pairs, which has the greater mass? (See Table 1.5.) a. 1.0 kg of feathers... Problem 78E: a. Calculate the mass of ethanol in 1.50 qt of ethanol. (See Table 1.5.) b. Calculate the mass of... Problem 79E: In each of the following pairs, which has the greater volume? a. 1.0 kg of feathers or 1.0 kg of... Problem 80E: Using Table 1.5, calculate the volume of 25.0 g of each of the following substances at 1 atm. a.... Problem 81E: The density of osmium (the densest metal) is 22.57 g/cm3. If a 1.00-kg rectangular block of osmium... Problem 82E: A copper wire (density = 8.96 g/cm3) has a diameter of 0.25 mm. If a sample of this copper wire has... Problem 83E: Match each description below with the following microscopic pictures. More than one picture may fit... Problem 84E: Define the following terms: solid, liquid, gas, pure substance, element, compound, homogeneous... Problem 85E: What is the difference between homogeneous and heterogeneous matter? Classify each of the following... Problem 86E: Classify the following mixtures as homogeneous or heterogeneous. a. potting soil b. white wine c.... Problem 87E: Classify each of the following as a mixture or a pure substance. a. water b. blood c. the oceans d.... Problem 88E: Suppose a teaspoon of magnesium filings and a teaspoon of powdered sulfur are placed together in a... Problem 89E: If a piece of hard, white blackboard chalk is heated strongly in a flame, the mass of the piece of... Problem 90E: During a very cold winter, the temperature may remain below freezing for extended periods. However,... Problem 91E: Classify the following as physical or chemical changes. a. Moth balls gradually vaporize in a... Problem 92E: The properties of a mixture are typically averages of the properties of its components. The... Problem 93AE: Two spherical objects have the same mass. One floats on water; the other sinks. Which object has the... Problem 94AE: A 194-g sample of caffeine (C8H10N4O2) contains 6.02 1023 molecules of caffeine. If a typical... Problem 95AE: Lipitor, a pharmaceutical drug that has been shown to lower bad cholesterol levels while raising... Problem 96AE: In Shakespeares Richard III, the First Murderer says: Take that, and that! [Stabs Clarence] If that... Problem 97AE Problem 98AE: In the opening scenes of the movie Raiders of the Lost Ark, Indiana Jones tries to remove a gold... Problem 99AE Problem 100AE: The active ingredient of aspirin tablets is acetylsalicylic acid, which, has a density of 1.4 g/cm3.... Problem 101AE: This year, like many past years, you begin to feel very sleepy alter eating a large helping of... Problem 102AE: Which of the following are chemical changes? Which are physical changes? a. the cutting of food b.... Problem 103AE: A person with high cholesterol has 250 mg of cholesterol per 100.0 mL of blood. If the total blood... Problem 104AE Problem 105AE: A column of liquid is found to expand linearly on heating. Assume the column rises 5.25 cm for a... Problem 106AE: A 25.00-g sample of a solid is placed in a graduated cylinder, and then the cylinder is filled to... Problem 107AE: For each of the following, decide which block is more dense; the orange block, the blue block, or it... Problem 108AE: According to the Official Rules of Baseball, a baseball must have a circumference not more than 9.25... Problem 109AE: The density of an irregularly shaped object was determined as follows. The mass of the object was... Problem 110AE: The chemist in Example 1.14 did some further experiments. She found that the pipet used to measure... Problem 111CWP: The longest river in the world is the Nile River with a length of 4145 mi. How long is the Nile in... Problem 112CWP: Secretariat is known as the horse with the fastest run in the Kentucky Derby. If Secretariats record... Problem 113CWP: The hottest temperature recorded in the United States is 134F in Greenland Ranch, CA. The melting... Problem 114CWP Problem 115CWP: Which of the following statements is(are) true? a. A spoonful of sugar is a mixture. b. Only... Problem 116CWP: Which of the following describes a chemical property? a. The density of iron is 7.87 g/cm3. b. A... Problem 117CP: A rule of thumb in designing experiments is to avoid using a result that is the small difference... Problem 118CP: Draw a picture showing the markings (graduations) on glassware that would allow you to make each of... Problem 119CP: Many times errors are expressed in terms of percentage. The percent error is die absolute value of... Problem 120CP: A person weighed 15 pennies on a balance and recorded the following masses: 3.112 g 3.109 g 3.059 g... Problem 121CP: On October 21, 1982, the Bureau of the Mint changed the composition of pennies (see Exercise 120).... Problem 122CP: As part of a science project, you study traffic patterns in your city at an intersection in the... Problem 123CP: Sterling silver is a solid solution of silver and copper. If a piece of a sterling silver necklace... Problem 124CP: Make molecular-level (microscopic) drawings for each of the following. a. Show the differences... Problem 125CP: Confronted with the box shown in the diagram, you wish to discover something about its internal... Problem 1RQ: Define and explain the differences between the following terms. a. law and theory b. theory and...
Related questions
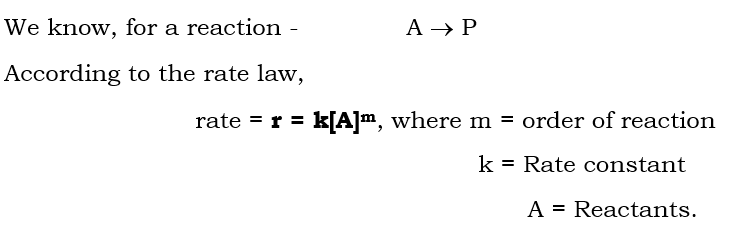
Problem Statementchemical reaction kinetics problems as follows:2
Definition Definition Study of the speed of chemical reactions and other factors that affect the rate of reaction. It also extends toward the mechanism involved in the reaction.
Expert Solution
Step by step
Solved in 4 steps with 4 images