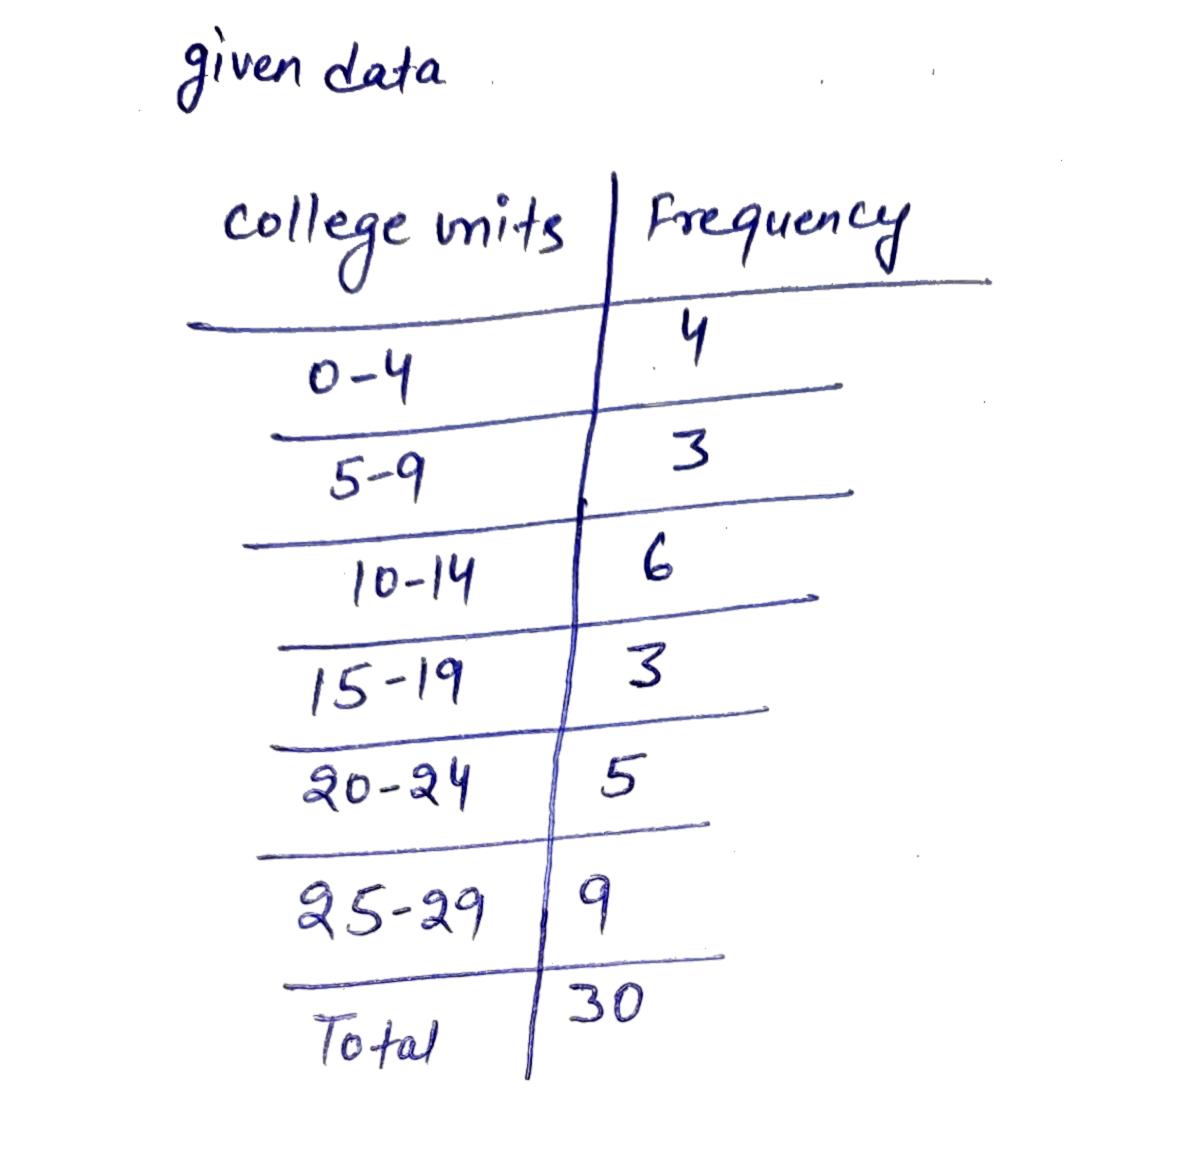
College Units Frequency 0-4 4 5-9 Find the standard deviation for the grouped data. 10- 14 15- 19 3 20 - 24 25-29 9 ... 3.
Q: 5. Interpreting a Boxplot Use the 2 boxplots below to answer the questions. Ages of Oscar Winning…
A: a. The Minimum Age of Female (21) Wining Oscar is lesser than a Male (28) and also Maximum age of…
Q: 5. Ages of Presidents The normal quantile plot represents the ages of presidents of the United…
A: It looks like you're referring to a normal quantile plot of the ages of U.S. presidents at their…
Q: The following frequency table summarizes 60 data values. What is the 3rd quartile of the data? Value…
A: n=60 To Find: Q3
Q: Hypothesis test of one mean. 1. An engineer wants to measure the bias in a pH Meter. She uses the…
A: Since you have posted multiple questions, we will provide the solution only to the first question as…
Q: 7, 12, 33, 33, 34, 37, 38, 40, 40, 41, 47, 51 2. The sample mean is about (а) 34.00 (b) 12.30 (c)…
A:
Q: (c) Carry out an appropriate hypothesis test at a = 0.05 to see whether the 2016 census proportions…
A: Given : Samples :
Q: how does this translate?
A: The two variables given are age and same-sex marriage. The descriptive statistics and correlation…
Q: The standard deviation of sample means is a function of both the standard deviation of the…
A: Solution Standard deviation of a sample mean is equal to Sd/✓n Where sd denote the Standard…
Q: Make a stem and leaf display of these data, considering the follow quote from baron von Richthofen…
A: The given quote is “cowboys are to be found among the sons of best families. The truth is probably…
Q: Coffee with Meals A researcher wishes to determine the number of cups of coffee a customer drinks…
A: Given that,
Q: 1. Find the Mean and Mode of the following data that the mass of certain worms Mass [1.2-1.5)…
A:
Q: f. Variance g. Std. Dev.
A: We will find the variance using excel.
Q: a. The equation for a line of regression, ŷ = a + bx, is: bırth rate = a + bgnp where gnp is the…
A:
Q: random sample. 7 cell phone full price $546.50 standard deviation $178 population mean $428.77…
A: Introduction: Denote μ as the true population mean price of the cell phones. It seems to be of…
Q: QI/ For the following data find: a. Mean b. Harmonic mean c. Absolute mean deviation Class Frequency…
A: Here, Interval Frequency, f Midpoint, x fx fx x-x |x-x| f.|x-x| 25-30 2 27.5 55 0.072727 -17.19…
Q: (a) Determine the population the investigator is sampling from. (b) Test at the 0.05 level of…
A:
Q: Consider the following sample data. Sample A: Sample B: Sample C: 10, 17, 24 68, 75, 82 1,035;…
A: Mean (x¯) = ∑xn _____________________________ standard dev(s) = ∑(x-x¯)2n-1
Q: How does the standard deviation help one's understanding of the set of data when used it and the…
A: The standard deviation measures the amount of spread in a set of data.
Q: 0 18 13 30 23 18 A data set contains the six values. What is the population standard…
A: The data set is 10,18,13,30,23,18sample size(n)=6
Q: Find the mean, median, and mode of the following population data. If necessary, round to 2 decimal…
A:
Q: The following data set belongs to a population: 5 -7 2 0 -9 16 10 7 Calculate the range, variance,…
A: Data 5,-7, 2,0,-9,16,10,7 Range=max-min
Q: (a) Is this an observational study or a designed experiment? Why? O A. This is an observational…
A: The researcher conducts a study to measure the walking speed of random travelers for departure and…
Q: 5. A researcher estimates that average length of road in a city is less than 634 feet. A random…
A: X (x-xbar)^2 725 4212 621 1528.8 592 4637.6 525 18252 638 488.41 463 38848 745 7208…
Q: Errors in chemical analysis The concentration of nitrate in a standard sample were measured by lab-1…
A: Given the concentration of nitrate in a standard sample were measured by lab-1 and the results of…
Q: The durations (minutes) of 26 electric power outages in the community of Sonando Heights over the…
A: Solution-: Given data: Xi:…
Q: A large statistics class meets on Monday, Wednesday, and Friday each week during the semester. The…
A: ClassesDayAbsent1Mon52Wed33Fri74Mon55Wed46Fri97Mon68Wed49Fri11
Q: Which one of the following statements is.17 ?TRUE The mode of the data 2, 5, 5, 3, 2, 3 is 2, .3 and…
A:
Q: 1) Find the mean Median and mode. Descriptive Statistics Data Mean…
A: Note: It is given that there are 26 electric outages. but there are 27 observations. Here, we are…
Q: 12. Meaning of the Dow The Dow Jones Industrial Average (DJIA) is a commonly used index of the…
A: From the provided information, Mean (µ) = 13.59 Standard deviation (σ) = 94.05
Q: Complete the table to find the sample Mean, Variance and Standard Deviation for the data shown…
A:
Q: Consider the following sample data. Sample A: 13, 23, 33 Sample B: 71, 81, 91 Sample C: 1,050;…
A: Given data: Sample A: 13, 23, 33 Sample B: 71, 81, 91 Sample C: 1,050; 1,060; 1,070 To…
Q: 1. Tabel : Frequency Distribution Interval Frequency 11 - 20 21 - 30 31 - 40 41 - 50 51 - 60 3 6 5 4…
A: Given data Interval Frequency (f) Midpoint (x) X2 f.x f.X2 11 - 20 3 11+202=15.5 15.52 =…
Q: The marks of 7 math students were recorded. Find the sample standard deviation. 61, 64, 65, 72, 78,…
A: Given: 61,64,65,72,78,81,86
Q: (a) Sketch the normal curve ("bell curve") listing all values 3 standard deviations from the mean in…
A: Let X be the random variable of the speed of automobiles on an expressway during rush hour. X~N(μ=62…
Q: 1. A computer manager needs to know how efficiency of her new computer program depends on the size…
A: Hi! Thank you for the question. As you have posted multiple sub-parts, according to our policy, we…
Q: QUESTION 26 In a statistics course, the course grade is computed based on midterm exam, Final exam,…
A:
Q: 3 2 Number of Snow Days 2 0 3 10 What is the mean absolute deviation of this data? (Round your…
A: Mean of this given data is ( 3+2+2+0+3+10) /6 = 20/6 = 3.33 ,…
Q: 3,7,3,3,2,3,4,3,4,6,1,3,2,3,5,2,3,1,5,2,6,5,4,10,4 find the value that is 1.5 standard deviations…
A:
Q: II. Identify the mean, variance, and standard deviation of the following tables then compute for the…
A: The grouped frequency distribution of the grades is given below. class f 61-65 2 66-70 3…
Q: The numbers of regular season wins for 5 188lbal excel since there are only FIVE values and it may…
A: Given, 15, 14, 10, 9, 2
Q: how can interprit the attached SPSS details?. I need an introduction with interpretation to…
A: There are three variables X1, X2, and X3. From the given output, we can check whether the…
Trending now
This is a popular solution!
Step by step
Solved in 2 steps with 2 images
- Years Height (cm) 0.9 0.79 2.0 3.98 2.1 4.81 4.0 11.41 4.8 29.72 5.2 24.2 6.2 26.81 9.0 91.47 9.1 129.45 Find the correlation coefficient and coefficient of determination for the data. Assess how well the line fits the data.Find the measures of center for following.Interval Freq 0 - 9 6 10 - 19 12 20 - 29 16 30 - 39 11 40 - 49 5 Calculate the mean and standard deviation for the table of sample data above.
- Descriptive statsFederal Government Employee E-mail Use It has been reported that 73% of federal government employees use e-mail. If a sample of 190 federal government employees is selected, find the mean, variance, and standard deviation of the number who use e-mail. Round your answers to three decimal places. Part: 0/ 2 Part 1 of 2 (a) Find the mean. Mean: μ %3D Part: 1/2 Part 2 of 2 (b) Find the variance and standard deviation. Variance: o = Standard deviation: o =Probability and statistics
- cw2 Here is a Frequency Distribution Table (FDT) for a small data set: data freq 33 1 34 2 35 2 36 3 37 12 Find the following measures of central tendency.IF THE ANSWER IS A DECIMAL, ROUND IT TO ONE DECIMAL PLACE!!mean = median = mode =z Scores LeBron James, one of the most successful basketball players of all time, has a height of 6 feet 8 inches, or 203 cm. Based on statistics from Data Set 1 “Body Data” in Appendix B, his height converts to the z score of 4.07. How many standard deviations is his height above the mean?Consider the following sample data. Sample A: 11, 22, 33 Sample B: 81, 92, 103 Sample C: 1,100; 1,111; 1,122 (a) Find the mean and standard deviation for each sample. Sample A: Sample B: Sample C: Mean Sample Standard Deviation (b) What does this exercise show about the standard deviation? multiple choice The idea is to illustrate that the standard deviation is not a function of the value of the mean. The idea is to illustrate that the standard deviation is a function of the value of the mean.