City planners believe that larger cities are populated by older residents. To investigate the relationship, data on population and the median age in 10 large cities were collected. City Population City (in millions) Median age Chicago, IL 2.833 31.5 Dallas, TX 1.233 30.5 Houston, TX 2.144 30.9 Los Angeles, CA 3.849 31.6 New York, NY 8.214 34.2 Philadelphia, PA 1.448 34.2 Phoenix, AZ 1.513 30.7 San Antonio, TX 1.297 31.7 San Diego, CA 1.257 32.5 San Jose, CA 0.930 32.6 Report and interpret the coefficient of determination: ____________% Write the regression equation that predicts median age: ŷ =___________ + ____________x Slope: 0.272 Correlation coefficient: 0.452 I tried to (0.452)^2 = .204304 to get the coefficient of determination and the practice checker is saying it is wrong. Is there a way in excel to do this problem that will be easier?


Inverse Normal Distribution
The method used for finding the corresponding z-critical value in a normal distribution using the known probability is said to be an inverse normal distribution. The inverse normal distribution is a continuous probability distribution with a family of two parameters.
Mean, Median, Mode
It is a descriptive summary of a data set. It can be defined by using some of the measures. The central tendencies do not provide information regarding individual data from the dataset. However, they give a summary of the data set. The central tendency or measure of central tendency is a central or typical value for a probability distribution.
Z-Scores
A z-score is a unit of measurement used in statistics to describe the position of a raw score in terms of its distance from the mean, measured with reference to standard deviation from the mean. Z-scores are useful in statistics because they allow comparison between two scores that belong to different normal distributions.
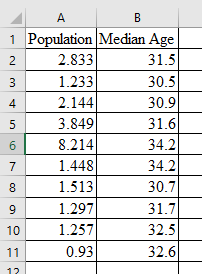
City planners believe that larger cities are populated by older residents. To investigate the relationship, data on population and the
| City | Population City (in millions) |
Median age |
| Chicago, IL | 2.833 | 31.5 |
| Dallas, TX | 1.233 | 30.5 |
| Houston, TX | 2.144 | 30.9 |
| Los Angeles, CA | 3.849 | 31.6 |
| New York, NY | 8.214 | 34.2 |
| Philadelphia, PA | 1.448 | 34.2 |
| Phoenix, AZ | 1.513 | 30.7 |
| San Antonio, TX | 1.297 | 31.7 |
| San Diego, CA | 1.257 | 32.5 |
| San Jose, CA | 0.930 | 32.6 |
- Report and interpret the coefficient of determination: ____________%
- Write the regression equation that predicts median age: ŷ =___________ + ____________x
- Slope: 0.272
Correlation coefficient : 0.452
I tried to (0.452)^2 = .204304 to get the coefficient of determination and the practice checker is saying it is wrong. Is there a way in excel to do this problem that will be easier?
Enter the given data into the excel as follows:

Trending now
This is a popular solution!

Step by step
Solved in 4 steps with 3 images


