Candies slate 70 Ted, 24 70 uie fnumber each color he results shown in the table. Test whether the bag of colored candies follows the distribution stated above at the a = 0.05 level of significance. E Click the icon to view the table. YA. H, The distribution of colors is the same as stated by the manufacturer. H,: The distribution of colors is not the same as stated by the manufacturer. O B. H, The distribution of colors is not the same as stated by the manufacturer. H,: The distribution of colors is the same as stated by the manufacturer. OC. None of these. Compute the expected counts for each color. Color Frequency Expected Count Brown 60 Yellow 66 Red 56 Blue 62 Orange 81 Green 65 (Round to two decimal places as needed.)
Candies slate 70 Ted, 24 70 uie fnumber each color he results shown in the table. Test whether the bag of colored candies follows the distribution stated above at the a = 0.05 level of significance. E Click the icon to view the table. YA. H, The distribution of colors is the same as stated by the manufacturer. H,: The distribution of colors is not the same as stated by the manufacturer. O B. H, The distribution of colors is not the same as stated by the manufacturer. H,: The distribution of colors is the same as stated by the manufacturer. OC. None of these. Compute the expected counts for each color. Color Frequency Expected Count Brown 60 Yellow 66 Red 56 Blue 62 Orange 81 Green 65 (Round to two decimal places as needed.)

MATLAB: An Introduction with Applications
6th Edition
ISBN:9781119256830
Author:Amos Gilat
Publisher:Amos Gilat
Chapter1: Starting With Matlab
Section: Chapter Questions
Problem 1P

Related questions
Topic Video
Question

Transcribed Image Text:A manufacturer of colored candies states that 13% of the candies in a bag should be brown, 14% yellow, 13% red, 24% blue, 20% orange, and 16% green. A student randomly selected a bag of colored candies. He counted the number of candies of each color and
the results shown in the table. Test whether the bag of colored candies follows the distribution stated above at the a = 0.05 level of significance.
E Click the icon to view the table.
VA. H,: The distribution of colors is the same as stated by the manufacturer.
H,: The distribution of colors is not the same as stated by the manufacturer.
O B. H,: The distribution of colors is not the same as stated by the manufacturer.
H,: The distribution of colors is the same as stated by the manufacturer.
O C. None of these.
ITE
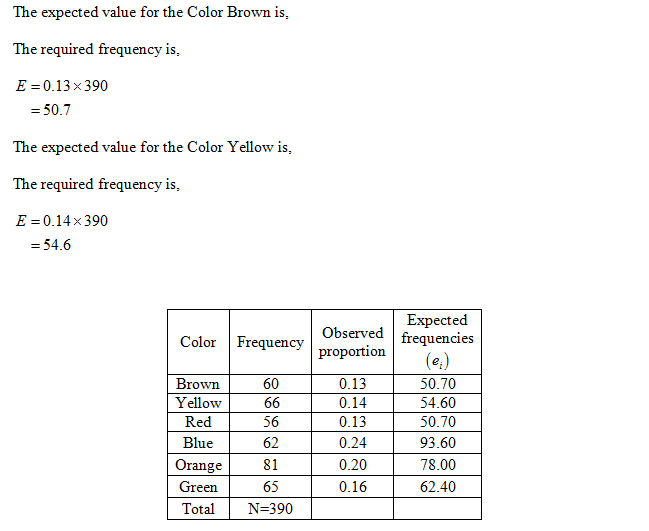
Compute the expected counts for each color.
Color
Frequency
Expected Count
Brown
60
Yellow
66
Red
56
Blue
62
Orange
81
Green
65
(Round to two decimal places as needed.)

Transcribed Image Text:- X
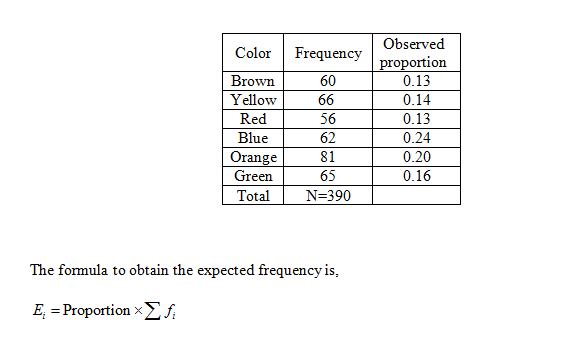
Observed Distribution of Colors
Colored Candies in a bag
Color
Frequency
Claimed Proportion
Brown
Yellow
Red
Blue
Orange Green
60
66
56
62
81
65
0.13
0.14
0.13
0.24
0.20
0.16
Expert Solution
Step 1
State the hypotheses.
Null hypothesis:
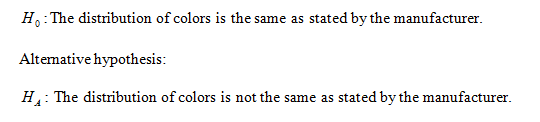
Correct option: Option A.
Obtain the expected counts for each color.
The expected counts for each color is obtained below as follows:
From the information, given that
Step 2

Step by step
Solved in 4 steps with 7 images

Knowledge Booster


Learn more about
Need a deep-dive on the concept behind this application? Look no further. Learn more about this topic, statistics and related others by exploring similar questions and additional content below.Recommended textbooks for you
MATLAB: An Introduction with Applications
Statistics
ISBN:
9781119256830
Author:
Amos Gilat
Publisher:
John Wiley & Sons Inc

Probability and Statistics for Engineering and th…
Statistics
ISBN:
9781305251809
Author:
Jay L. Devore
Publisher:
Cengage Learning

Statistics for The Behavioral Sciences (MindTap C…
Statistics
ISBN:
9781305504912
Author:
Frederick J Gravetter, Larry B. Wallnau
Publisher:
Cengage Learning
MATLAB: An Introduction with Applications
Statistics
ISBN:
9781119256830
Author:
Amos Gilat
Publisher:
John Wiley & Sons Inc
Probability and Statistics for Engineering and th…
Statistics
ISBN:
9781305251809
Author:
Jay L. Devore
Publisher:
Cengage Learning
Statistics for The Behavioral Sciences (MindTap C…
Statistics
ISBN:
9781305504912
Author:
Frederick J Gravetter, Larry B. Wallnau
Publisher:
Cengage Learning

Elementary Statistics: Picturing the World (7th E…
Statistics
ISBN:
9780134683416
Author:
Ron Larson, Betsy Farber
Publisher:
PEARSON

The Basic Practice of Statistics
Statistics
ISBN:
9781319042578
Author:
David S. Moore, William I. Notz, Michael A. Fligner
Publisher:
W. H. Freeman

Introduction to the Practice of Statistics
Statistics
ISBN:
9781319013387
Author:
David S. Moore, George P. McCabe, Bruce A. Craig
Publisher:
W. H. Freeman