The image shows a Cartesian plane with two separate graphs. ### Graph 1: - **Characteristics**: This graph appears as a combination of a linear and a curvilinear function that starts from the top left quadrant and moves to the right. - **Description**: - The graph begins at approximately y = 5 at x = -7 and descends into a sharp V-like dip around x = -4.5. - It then rises to a peak near x = -3 and dips again before increasing to a point roughly at (1.5, 0), where there is a solid black dot, indicating the endpoint of this segment. - Before this endpoint, the graph has a saddle point or moderate peak near x = -1 and dips slightly before reaching the end. ### Graph 2: - **Characteristics**: A horizontal line segment; it includes endpoints that are circles. - **Description**: - This line spans from x = -5 to x = 4 on the y = 0 line. - The endpoints (at x = -5 and x = 4) are marked with open circles, indicating these endpoints are not included in the interval defined by the line segment. ### Additional Information: - Both graphs are plotted over a grid, providing clear intersection points for reference. - The x-axis and y-axis both range from -7 to 7, with units marked along them. - The black dot in the first graph suggests the endpoint of the function, contrasting with the open circles in the second graph, which indicate that these points are not included in the function's interval on the x-axis. This graph can be used to explore concepts of function continuity, endpoints, and interval notation in educational contexts.
The image shows a Cartesian plane with two separate graphs. ### Graph 1: - **Characteristics**: This graph appears as a combination of a linear and a curvilinear function that starts from the top left quadrant and moves to the right. - **Description**: - The graph begins at approximately y = 5 at x = -7 and descends into a sharp V-like dip around x = -4.5. - It then rises to a peak near x = -3 and dips again before increasing to a point roughly at (1.5, 0), where there is a solid black dot, indicating the endpoint of this segment. - Before this endpoint, the graph has a saddle point or moderate peak near x = -1 and dips slightly before reaching the end. ### Graph 2: - **Characteristics**: A horizontal line segment; it includes endpoints that are circles. - **Description**: - This line spans from x = -5 to x = 4 on the y = 0 line. - The endpoints (at x = -5 and x = 4) are marked with open circles, indicating these endpoints are not included in the interval defined by the line segment. ### Additional Information: - Both graphs are plotted over a grid, providing clear intersection points for reference. - The x-axis and y-axis both range from -7 to 7, with units marked along them. - The black dot in the first graph suggests the endpoint of the function, contrasting with the open circles in the second graph, which indicate that these points are not included in the function's interval on the x-axis. This graph can be used to explore concepts of function continuity, endpoints, and interval notation in educational contexts.

Calculus: Early Transcendentals
8th Edition
ISBN:9781285741550
Author:James Stewart
Publisher:James Stewart
Chapter1: Functions And Models
Section: Chapter Questions
Problem 1RCC: (a) What is a function? What are its domain and range? (b) What is the graph of a function? (c) How...

Related questions
Question
graph the derivative

Transcribed Image Text:The image shows a Cartesian plane with two separate graphs.
### Graph 1:
- **Characteristics**: This graph appears as a combination of a linear and a curvilinear function that starts from the top left quadrant and moves to the right.
- **Description**:
- The graph begins at approximately y = 5 at x = -7 and descends into a sharp V-like dip around x = -4.5.
- It then rises to a peak near x = -3 and dips again before increasing to a point roughly at (1.5, 0), where there is a solid black dot, indicating the endpoint of this segment.
- Before this endpoint, the graph has a saddle point or moderate peak near x = -1 and dips slightly before reaching the end.
### Graph 2:
- **Characteristics**: A horizontal line segment; it includes endpoints that are circles.
- **Description**:
- This line spans from x = -5 to x = 4 on the y = 0 line.
- The endpoints (at x = -5 and x = 4) are marked with open circles, indicating these endpoints are not included in the interval defined by the line segment.
### Additional Information:
- Both graphs are plotted over a grid, providing clear intersection points for reference.
- The x-axis and y-axis both range from -7 to 7, with units marked along them.
- The black dot in the first graph suggests the endpoint of the function, contrasting with the open circles in the second graph, which indicate that these points are not included in the function's interval on the x-axis.
This graph can be used to explore concepts of function continuity, endpoints, and interval notation in educational contexts.
Expert Solution
Step 1
Draw the graph of the derivative of the given graphical function.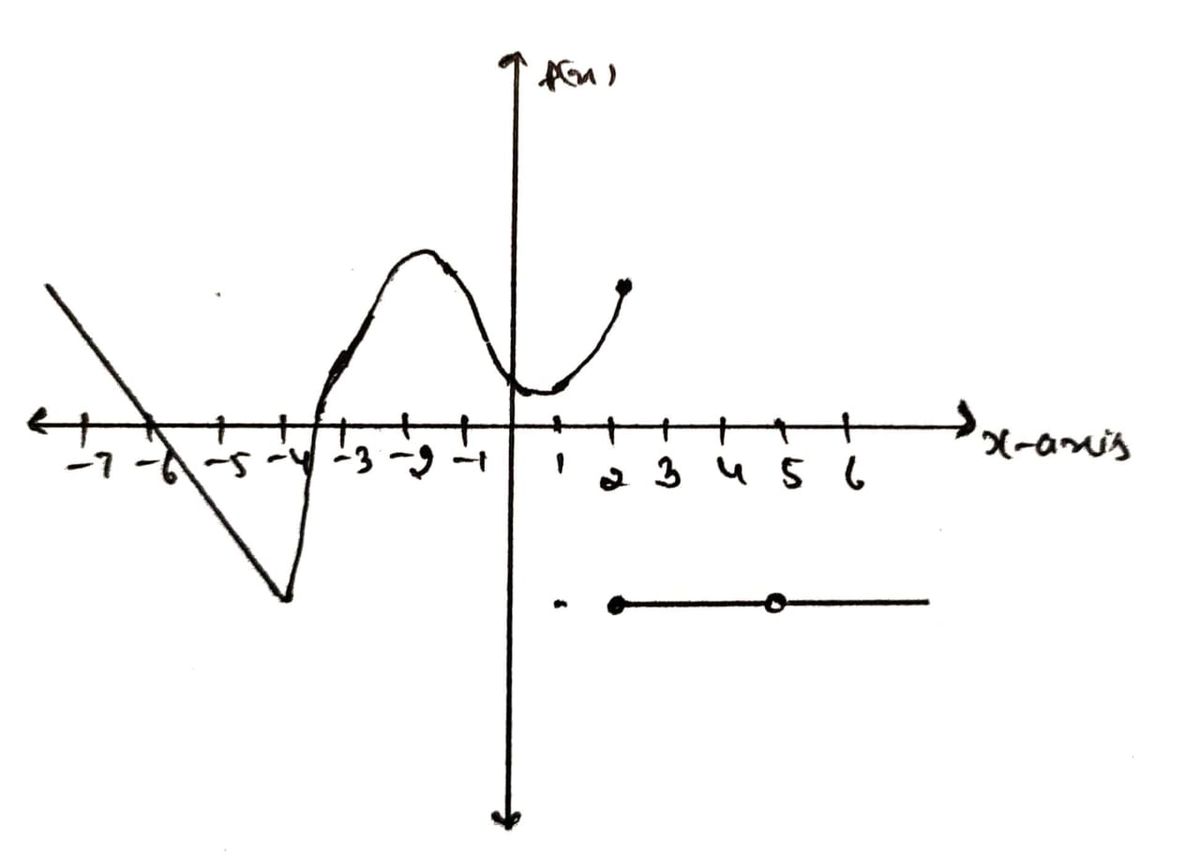

Step by step
Solved in 2 steps with 2 images

Recommended textbooks for you
Calculus: Early Transcendentals
Calculus
ISBN:
9781285741550
Author:
James Stewart
Publisher:
Cengage Learning

Thomas' Calculus (14th Edition)
Calculus
ISBN:
9780134438986
Author:
Joel R. Hass, Christopher E. Heil, Maurice D. Weir
Publisher:
PEARSON

Calculus: Early Transcendentals (3rd Edition)
Calculus
ISBN:
9780134763644
Author:
William L. Briggs, Lyle Cochran, Bernard Gillett, Eric Schulz
Publisher:
PEARSON
Calculus: Early Transcendentals
Calculus
ISBN:
9781285741550
Author:
James Stewart
Publisher:
Cengage Learning
Thomas' Calculus (14th Edition)
Calculus
ISBN:
9780134438986
Author:
Joel R. Hass, Christopher E. Heil, Maurice D. Weir
Publisher:
PEARSON
Calculus: Early Transcendentals (3rd Edition)
Calculus
ISBN:
9780134763644
Author:
William L. Briggs, Lyle Cochran, Bernard Gillett, Eric Schulz
Publisher:
PEARSON

Calculus: Early Transcendentals
Calculus
ISBN:
9781319050740
Author:
Jon Rogawski, Colin Adams, Robert Franzosa
Publisher:
W. H. Freeman


Calculus: Early Transcendental Functions
Calculus
ISBN:
9781337552516
Author:
Ron Larson, Bruce H. Edwards
Publisher:
Cengage Learning