Essentials Of Investments
11th Edition
ISBN:9781260013924
Author:Bodie, Zvi, Kane, Alex, MARCUS, Alan J.
Publisher:Bodie, Zvi, Kane, Alex, MARCUS, Alan J.
Chapter1: Investments: Background And Issues
Section: Chapter Questions
Problem 1PS
Related questions
Question
Calculate the Asset Turnover for Potbelly Corp, 2015. Use highlighted excel info
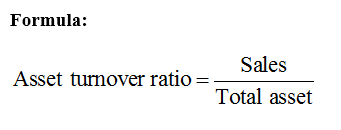
Formula: Sales / Average Total Assets

Transcribed Image Text:Conditional Format
Cell
en v Av
E Merge & Center v
$ - % 9
Paste
BIUV
Formatting as Table Styles
A Format v
H38
V fx 191.947
K
M
N
H.
Operating Activities - Net Cash Flow
26.5540
Total Receivables
Net Sales
Total Interest and Related Expense
Net Income Loss)
4.3580
Total Liabilities
Total Liabilities and Stockholders Equity
191.9470
1
35.6220
4.0160
326.9790
0.1790
38
44.2940
5.6280
40.3200
4.4610
372.8490
0.2210
39
174.5070
51.2090
407.1310
0.1340
45.9690
41.8190
40
175.4450
8.2120
3.7870
53.4920
-6.9560
5.0870
428.1110
0.1240
41
170.7300
0.0000
424.0020
5.9100
-1.5250
-0.8480
0.0010
0.0000
42
150.3470
703.5720
335.1950
4.7570
27.1680
3.2200
15.2080
43
349.8240
20.9130
57.5460
4.1410
452.0830
6.4270
44
727.1570

Transcribed Image Text:Home
Insert
Draw
Page Layout
Formulas
Data
Review
View
Data Mining
Analytic Solver
O Tell me
e Share
O Comments
A A
マ0.
Cambria
11
!!
22 Wrap Text v
Custom
A Insertv
Σ.
EX Delete v
Paste
BIUV
田、
A
$ v % 2
Sort &
Ov Filter
E E Merge & Center v
Conditional Format
Formatting as Table Styles
Cell
Find &
Select
Ideas
Sensitivity
H Format v
B38
v fx 12/31/2014
K
1 Data Date Data Year- Fiscal
38 31Dec14
39 31Dec15
40 31Dec16
41 31Dec17
42 31Dec14
43 31Dec15
Company Name
POTBELLY CORP
Total Assets
Cash and Short-Term Investments
63.0050
Current Liabilities - Total
Total Liabilities and Stockholders Equity
Total Liabilities
35.6220
44.2940
Net Income (Loss)
Operating Activities - Net Cash
26.5540
2014
191.9470
20.8840
191.9470
4.3580
2015
POTBELLY CORP
POTBELLY CORP
POTBELLY CORP
DEL TACO RESTAURANTSINC
DEL TACO RESTAURANTS INC
174.5070
32.0060
25.1820
174.5070
5.6280
40.3200
2016
175.4450
23.3790
278150
175.4450
51.2090
8.2120
45.9690
2017
170.7300
25.5300
27.3520
170.7300
53.4920
-6.9560
41.8190
2014
150.3470
0.2300
0.6600
150.3470
5.9100
-1.5250
-0.8480
2015
703.5720
10.1940
51.4530
703.5720
335.1950
4.7570
27.1680
Expert Solution
Step 1

Step 2
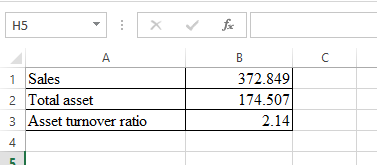
Computation:

Hence, the asset turnover ratio is 2.14.
Step by step
Solved in 3 steps with 3 images

Knowledge Booster
Learn more about
Need a deep-dive on the concept behind this application? Look no further. Learn more about this topic, finance and related others by exploring similar questions and additional content below.Recommended textbooks for you

Essentials Of Investments
Finance
ISBN:
9781260013924
Author:
Bodie, Zvi, Kane, Alex, MARCUS, Alan J.
Publisher:
Mcgraw-hill Education,


Essentials Of Investments
Finance
ISBN:
9781260013924
Author:
Bodie, Zvi, Kane, Alex, MARCUS, Alan J.
Publisher:
Mcgraw-hill Education,


Foundations Of Finance
Finance
ISBN:
9780134897264
Author:
KEOWN, Arthur J., Martin, John D., PETTY, J. William
Publisher:
Pearson,

Fundamentals of Financial Management (MindTap Cou…
Finance
ISBN:
9781337395250
Author:
Eugene F. Brigham, Joel F. Houston
Publisher:
Cengage Learning

Corporate Finance (The Mcgraw-hill/Irwin Series i…
Finance
ISBN:
9780077861759
Author:
Stephen A. Ross Franco Modigliani Professor of Financial Economics Professor, Randolph W Westerfield Robert R. Dockson Deans Chair in Bus. Admin., Jeffrey Jaffe, Bradford D Jordan Professor
Publisher:
McGraw-Hill Education