calculate a confidence interval for the true mean of the population of all home sales prices for this town. 1. In one to two complete
Using the home sales prices data attached, calculate a confidence interval for the true
1. In one to two complete sentences, explain what this confidence interval means for this particular study. State clearly, using the meaning of the confidence interval in terms of the words and context of the problem described.
2. What happens to the EBM as the confidence level increases? Does the width of the confidence interval increase or decrease? Explain why.

From the sales price data,
The sample size is, n=20
The sample mean is,
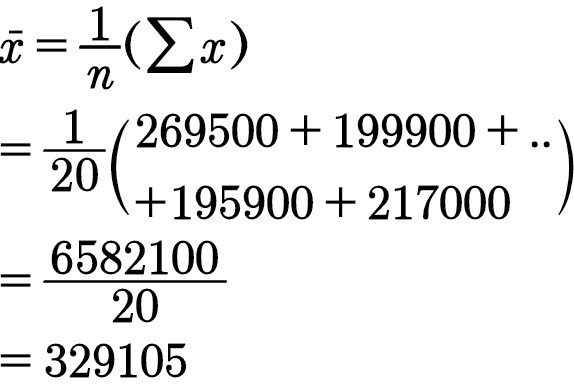
The sample standard deviation is,

2)
Let  denote the average sales of a price of home.
The average price of home in 2008 was $390,000
The mayor's claim is that the average sales of a price of home is not less than the average precession price in 2008.
The null hypothesis is that the average sales of a price of home is not less than the average precession price in 2008.
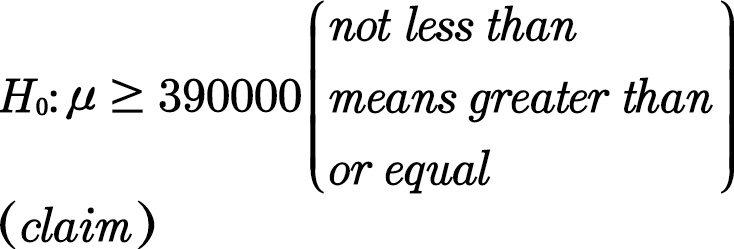
The alternative hypothesis is the average sales of a price of home is less than the average precession price in 2008.

The test statistic is,
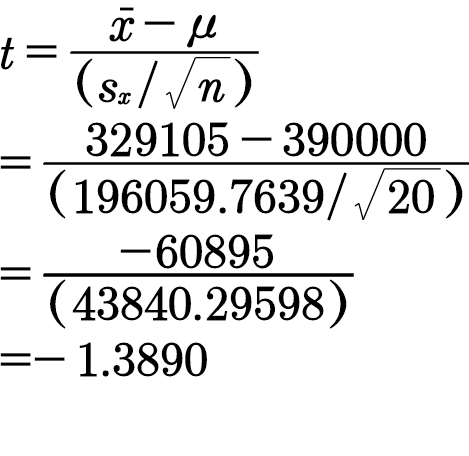
The level of significance is,

From the alternative hypothesis it is clear that the test is right tailed test.
The degrees of freedom is,
Df= n-1=20-1=19
From t table at 0.10 level of significance with 19 degrees of freedom, the right tailed critical value is,
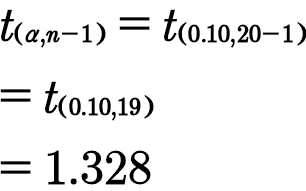
Decision rule:
Reject the null hypothesis if

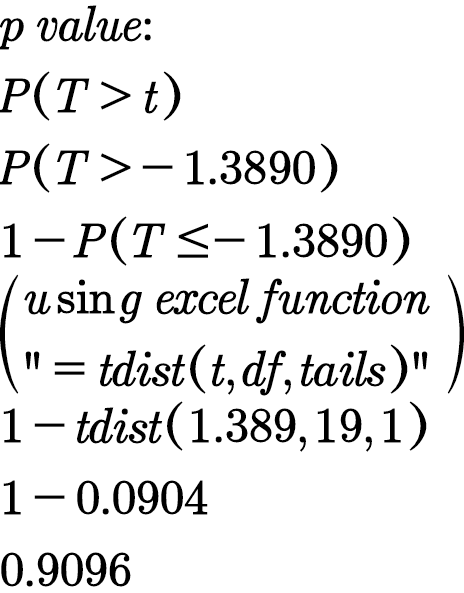
Computation of p value:
Decision :
Reject the null hypothesis if p value is less than the level of significance.
Here, p value is 0.9096 which is greater than 0.10 . so fail to reject the null hypothesis and conclude that the average sales of a price of home is not less than the average precession price in 2008.
Trending now
This is a popular solution!
Step by step
Solved in 4 steps with 12 images


