C. The test-statistic for this data = 14.582 X (Please show your answer to three decimal places.) d. The p-value for this sample =| 0.0057 X (Please show your answer to four decimal places.)
Addition Rule of Probability
It simply refers to the likelihood of an event taking place whenever the occurrence of an event is uncertain. The probability of a single event can be calculated by dividing the number of successful trials of that event by the total number of trials.
Expected Value
When a large number of trials are performed for any random variable ‘X’, the predicted result is most likely the mean of all the outcomes for the random variable and it is known as expected value also known as expectation. The expected value, also known as the expectation, is denoted by: E(X).
Probability Distributions
Understanding probability is necessary to know the probability distributions. In statistics, probability is how the uncertainty of an event is measured. This event can be anything. The most common examples include tossing a coin, rolling a die, or choosing a card. Each of these events has multiple possibilities. Every such possibility is measured with the help of probability. To be more precise, the probability is used for calculating the occurrence of events that may or may not happen. Probability does not give sure results. Unless the probability of any event is 1, the different outcomes may or may not happen in real life, regardless of how less or how more their probability is.
Basic Probability
The simple definition of probability it is a chance of the occurrence of an event. It is defined in numerical form and the probability value is between 0 to 1. The probability value 0 indicates that there is no chance of that event occurring and the probability value 1 indicates that the event will occur. Sum of the probability value must be 1. The probability value is never a negative number. If it happens, then recheck the calculation.
Only parts c and d
![Is the racial distribution for students on work study different from the racial distribution for students not
on work study? The results of a recent study are shown below.
Frequencies of Race for Students On and Not On Work Study
Black Hispanic
White
Asian
Other
Work Study
Not Work Study
96
45
93
56
22
76
64
72
72
39
What can be concluded at the a = 0.01 significance level
%3D
a. What is the correct statistical test to use?
O Goodness-of-Fit
O Independence
Paired t-test
Homogeneity
b. What are the null and alternative hypotheses?
Но:
O Race and work study status are independent.
Race and work study status are dependent.
O The racial distribution for students on work study is not the same as it is for students not on
work study.
The racial distribution for students on work study is the same as it is for students not on work
study.](/v2/_next/image?url=https%3A%2F%2Fcontent.bartleby.com%2Fqna-images%2Fquestion%2F26011c77-5c4f-4664-9671-6ed66fb50c54%2F5296cce0-80bb-440d-b5a9-5d7155df90c6%2Fhmcphoh_processed.jpeg&w=3840&q=75)
![H1:
O Race and work study status are dependent.
O The racial distribution for students on work study is not the same as it is for students not on
work study.
O The racial distribution for students on work study is the same as it is for students not on work
study.
O Race and work study status are independent.
C. The test-statistic for this data
14.582
X (Please show your answer to three decimal places.)
d. The p-value for this sample
0.0057
X (Please show your answer to four decimal places.)
e. The p-value is | less than (or equal to) ▼
f. Based on this, we should
O reject the null
O accept the null
O fail to reject the null
g. Thus, the final conclusion is...
There is sufficient evidence to conclude that the racial distribution for students on work study
is not the same as it is for students not on work study.
There is insufficient evidence to conclude that the racial distribution for students on work
study is not the same as it is for students not on work study.
There is sufficient exidence to conclude that the racial distribution for students on work study](/v2/_next/image?url=https%3A%2F%2Fcontent.bartleby.com%2Fqna-images%2Fquestion%2F26011c77-5c4f-4664-9671-6ed66fb50c54%2F5296cce0-80bb-440d-b5a9-5d7155df90c6%2Fwyv7c8b_processed.jpeg&w=3840&q=75)
![](/static/compass_v2/shared-icons/check-mark.png)
It is asked to find test statistic for the given data.
To find test statistic we'll perform chi-square test.
The formula to find test statistic chi-square is as follows;
Where ,
O is the observed count and it is given in this example.
E is the expected count and to find this formula is ,
First step is to find Row and column total for the given data set.
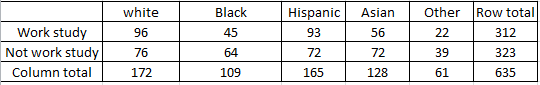
Note : Grand total is 635.
Let's find expected counts now.
Expected count , E :
white | Black | Hispanic | Asian | Other | |
Work study | =84.51 |
=53.56 |
=81.07 |
=62.89 | =29.97 |
Not work study | =87.49 | =55.44 |
=83.93 |
=65.11 | =31.039 |
Step by step
Solved in 4 steps with 3 images
![Blurred answer](/static/compass_v2/solution-images/blurred-answer.jpg)
![MATLAB: An Introduction with Applications](https://www.bartleby.com/isbn_cover_images/9781119256830/9781119256830_smallCoverImage.gif)
![Probability and Statistics for Engineering and th…](https://www.bartleby.com/isbn_cover_images/9781305251809/9781305251809_smallCoverImage.gif)
![Statistics for The Behavioral Sciences (MindTap C…](https://www.bartleby.com/isbn_cover_images/9781305504912/9781305504912_smallCoverImage.gif)
![Elementary Statistics: Picturing the World (7th E…](https://www.bartleby.com/isbn_cover_images/9780134683416/9780134683416_smallCoverImage.gif)
![The Basic Practice of Statistics](https://www.bartleby.com/isbn_cover_images/9781319042578/9781319042578_smallCoverImage.gif)
![Introduction to the Practice of Statistics](https://www.bartleby.com/isbn_cover_images/9781319013387/9781319013387_smallCoverImage.gif)