(c) Plot each data set along with the regression line and comment on your results. (d) Data set 3 appears to contain an outlier. Remove the apparent out- lier and reanalyze the data using a linear regression. Comment on your result. (e) Briefly comment on the importance of visually examining your
(c) Plot each data set along with the regression line and comment on your results. (d) Data set 3 appears to contain an outlier. Remove the apparent out- lier and reanalyze the data using a linear regression. Comment on your result. (e) Briefly comment on the importance of visually examining your

MATLAB: An Introduction with Applications
6th Edition
ISBN:9781119256830
Author:Amos Gilat
Publisher:Amos Gilat
Chapter1: Starting With Matlab
Section: Chapter Questions
Problem 1P

Related questions
Question
100%
Part c, d, and e please

Transcribed Image Text:9.96
7.24
4.26
0.84
4.82
5.68
8.10
6.13
3.10
9.13
7.26
4.74
8.84
6.08
5.39
8.15
6.42
5.73
(a) An unweighted linear regression analysis for the three data sets gives
nearly identical results. To three significant figures, each data set
has a slope of 0.500 and a y-intercept of 3.00. The standard devia-
tions in the slope and the y-intercept are 0.118 and 1.125 for each
data set. All three standard deviations about the regression are 1.24.
Based on these results for a linear regression analysis, comment on
the similarity of the data sets.
(b) Complete a linear regression analysis for each data set and verify
that the results from part (a) are correct. Construct a residual plot
for each data set. Do these plots change your conclusion from part
(a)? Explain.
(c) Plot each data set along with the regression line and comment on
your results.
(d) Data set 3 appears to contain an outlier. Remove the apparent out-
lier and reanalyze the data using a linear regression. Comment on
your result.
(e) Briefly comment on the importance of visually examining your
data.
13. Fanke and co-workers evaluated a standard additions method for a
voltammetric determination of Tl. 16 A summary of their results is tabu-

Transcribed Image Text:significance level as in the original problem.
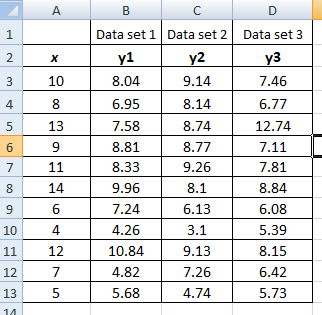
12. Consider the following three data sets, each of which gives values of y
for the same values of x.
X
10.00
8.00
13.00
9.00
11.00
14.00
6.00
4.00
12.00
7.00
5.00
Analytical Chemistry 2.1
Data Set 1 Data Set 2 Data Set 3
1/2
V3
9.14
7.46
8.14
6.77
8.74
12.74
8.77
7.11
9.26
7.81
8.10
8.84
6.13
6.08
3.10
5.39
9.13
8.15
7.26
6.42
4.74
5.73
31
8.04
6.95
7.58
8.81
8.33
9.96
7.24
4.26
10.84
4.82
5.68
(a) An unweighted linear regression ana
nearly identical results. To three si
has a slope of 0.500 and a y-interce
tions in the slope and the y-intercep
data set. All three standard deviation
Based on these results for a linear re
the similarity of the data sets.
(b) Camalı
1:
Expert Solution
Step 1
Given data set is displayed below.

Step by step
Solved in 4 steps with 10 images

Recommended textbooks for you
MATLAB: An Introduction with Applications
Statistics
ISBN:
9781119256830
Author:
Amos Gilat
Publisher:
John Wiley & Sons Inc

Probability and Statistics for Engineering and th…
Statistics
ISBN:
9781305251809
Author:
Jay L. Devore
Publisher:
Cengage Learning

Statistics for The Behavioral Sciences (MindTap C…
Statistics
ISBN:
9781305504912
Author:
Frederick J Gravetter, Larry B. Wallnau
Publisher:
Cengage Learning
MATLAB: An Introduction with Applications
Statistics
ISBN:
9781119256830
Author:
Amos Gilat
Publisher:
John Wiley & Sons Inc
Probability and Statistics for Engineering and th…
Statistics
ISBN:
9781305251809
Author:
Jay L. Devore
Publisher:
Cengage Learning
Statistics for The Behavioral Sciences (MindTap C…
Statistics
ISBN:
9781305504912
Author:
Frederick J Gravetter, Larry B. Wallnau
Publisher:
Cengage Learning

Elementary Statistics: Picturing the World (7th E…
Statistics
ISBN:
9780134683416
Author:
Ron Larson, Betsy Farber
Publisher:
PEARSON

The Basic Practice of Statistics
Statistics
ISBN:
9781319042578
Author:
David S. Moore, William I. Notz, Michael A. Fligner
Publisher:
W. H. Freeman

Introduction to the Practice of Statistics
Statistics
ISBN:
9781319013387
Author:
David S. Moore, George P. McCabe, Bruce A. Craig
Publisher:
W. H. Freeman