BUS Ch9 10 The Monopolist view of Total Revenue, Average Revenue, and Marginal Revenue. 33. The demand curve the monopolist faces is the firm's AR Fnce curve. 34. TR, = PQ 35. AR, - P.*Q /Q, - P. 36. What is the relationship between marginal values and average values? 37. As Q 1: If MR>AR then AR 1 38. As Q 1: I MR< AR then AR; 39. What is AR dolng as Q T ?? 40. What is the implication of MR=0? 5:12 / 5:40 YouTube CC 5. In the video, the graph indicates that firm's average revenue curve is the market elect one: D a. demand curve O b. supply curve D c. equilibrium Check
BUS Ch9 10 The Monopolist view of Total Revenue, Average Revenue, and Marginal Revenue. 33. The demand curve the monopolist faces is the firm's AR Fnce curve. 34. TR, = PQ 35. AR, - P.*Q /Q, - P. 36. What is the relationship between marginal values and average values? 37. As Q 1: If MR>AR then AR 1 38. As Q 1: I MR< AR then AR; 39. What is AR dolng as Q T ?? 40. What is the implication of MR=0? 5:12 / 5:40 YouTube CC 5. In the video, the graph indicates that firm's average revenue curve is the market elect one: D a. demand curve O b. supply curve D c. equilibrium Check

Chapter1: Making Economics Decisions
Section: Chapter Questions
Problem 1QTC

Related questions
Question
100%

Transcribed Image Text:**Title: Understanding Monopoly: Key Economic Concepts**
**Chapter: The Monopolist View of Total Revenue, Average Revenue, and Marginal Revenue**
**Video Overview (BUS Ch9-10, Section 11, Minutes: 33-40):**
- **Time Marker:** 6:06
- **Main Topic:** An analysis of monopoly through the lens of total revenue, average revenue, and marginal revenue.
**Key Points:**
33. **Demand Curve:** In a monopoly, the demand curve represents the firm’s average revenue (AR).
34. **Total Revenue (TR):** \( TR = PQ \), where \( Q = P_a \).
35. **Average Revenue (AR):** \( AR = \frac{P_aQ}{Q} = P_a \).
36. **Relationship Between Marginal and Average Values:**
- When marginal revenue (MR) is greater than average revenue (AR), AR is rising.
- When MR is less than AR, AR is declining.
37. **Effects on Average Revenue:**
- Increases in quantity (Q) lead to changes in AR depending on MR.
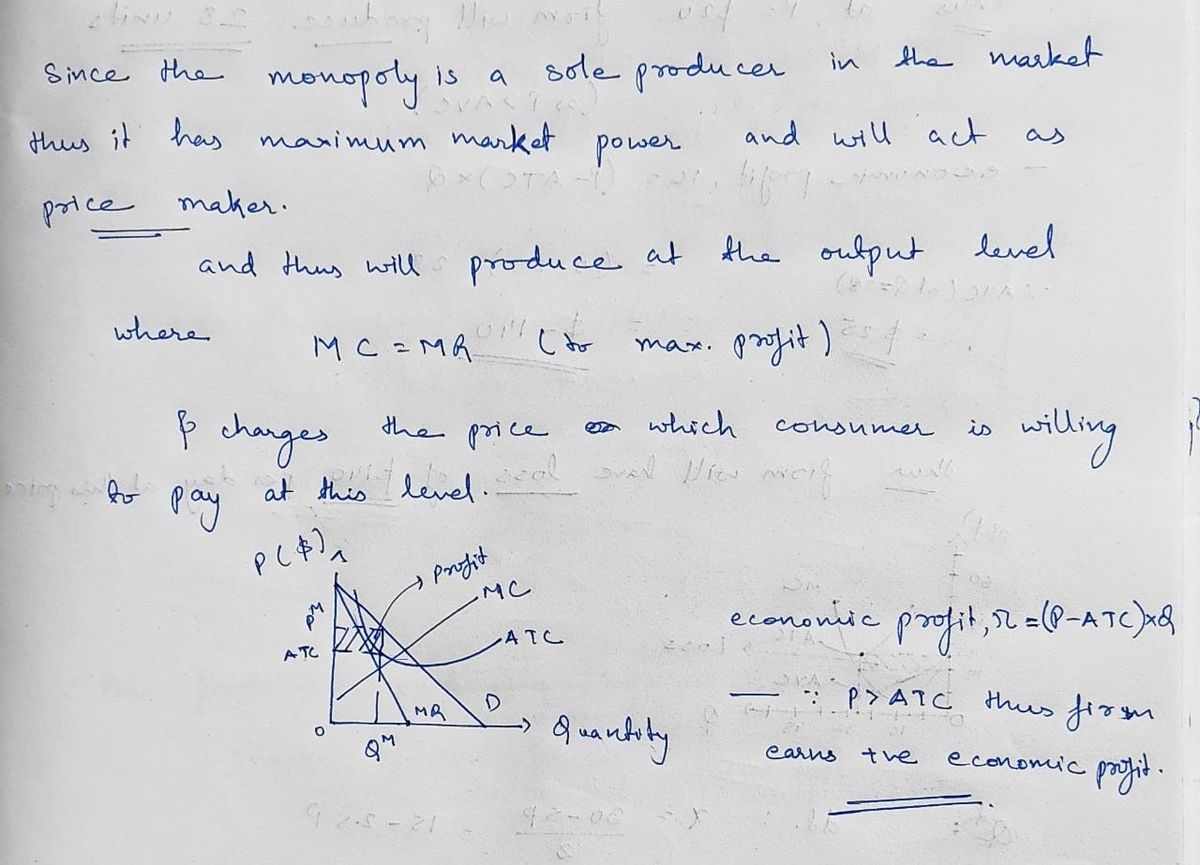
39. **Graph Explanation:**
- The graph illustrates various economic relationships:
- The horizontal axis represents quantity (Q).
- The vertical axis represents price and revenue.
- Different lines depict demand, marginal revenue, and average revenue trends within the monopoly context.
40. **Marginal Revenue Implications:**
- A focus on what happens when MR equals zero.
**Post-Video Question:**
65. **Understanding the Graph:**
- **Question:** In the video, the graph indicates that the firm’s average revenue curve is the market _____?
- **Options:**
- a. demand curve
- b. supply curve
- c. equilibrium
**Instruction:** Select the correct option and click "Check" to submit your answer.
Expert Solution
Step 1

Step by step
Solved in 2 steps with 2 images

Knowledge Booster


Learn more about
Need a deep-dive on the concept behind this application? Look no further. Learn more about this topic, economics and related others by exploring similar questions and additional content below.Recommended textbooks for you

Principles of Economics (12th Edition)
Economics
ISBN:
9780134078779
Author:
Karl E. Case, Ray C. Fair, Sharon E. Oster
Publisher:
PEARSON

Engineering Economy (17th Edition)
Economics
ISBN:
9780134870069
Author:
William G. Sullivan, Elin M. Wicks, C. Patrick Koelling
Publisher:
PEARSON
Principles of Economics (12th Edition)
Economics
ISBN:
9780134078779
Author:
Karl E. Case, Ray C. Fair, Sharon E. Oster
Publisher:
PEARSON
Engineering Economy (17th Edition)
Economics
ISBN:
9780134870069
Author:
William G. Sullivan, Elin M. Wicks, C. Patrick Koelling
Publisher:
PEARSON

Principles of Economics (MindTap Course List)
Economics
ISBN:
9781305585126
Author:
N. Gregory Mankiw
Publisher:
Cengage Learning

Managerial Economics: A Problem Solving Approach
Economics
ISBN:
9781337106665
Author:
Luke M. Froeb, Brian T. McCann, Michael R. Ward, Mike Shor
Publisher:
Cengage Learning

Managerial Economics & Business Strategy (Mcgraw-…
Economics
ISBN:
9781259290619
Author:
Michael Baye, Jeff Prince
Publisher:
McGraw-Hill Education