Brand C SOME METHODS BASED ON RANKS В A 82 84 73 79 80 64 71 81 67 75 77 62 70 Do these results indicate a significant difference between brands? If so, which brands Four job training programs were tried on 20 new employees, where 5 employees randomly assigned to each training program. The 20 employees were then placed under the same supervisor and, at the end of a certain specified period, the supervisor ranked the employees' according to job ability, with the lowest ranks being assigned to those appear to differ? were mme 2 employees with the lowest job ability Ranks Program PP 4, 6, 7, 2, 10 1, 8, 12, 3, 11 20, 19, 16, 14, 5 18, 15, 17, 13, 9 4 9 alh Do these data indicate a difference in the effectiveness of the various training programs? AA bort So, which ones seem to be different? 3. The amount of damage to the soil on a farm caused by water and wind is examined for many different farms. At the same time the type of farming practiced on each farm is noted, with the following results. Type of Farming Minimum Tillage Contour Amount of Damage Terrace Other Number of Farms No damage Slight damage Moderate damage Severe damage 17 19 21 4 3 10 4 0 2 34 2 0 0 2 Does the type of farming affect the degree of damage? If an significantly different? Three di ming are 1 23
Contingency Table
A contingency table can be defined as the visual representation of the relationship between two or more categorical variables that can be evaluated and registered. It is a categorical version of the scatterplot, which is used to investigate the linear relationship between two variables. A contingency table is indeed a type of frequency distribution table that displays two variables at the same time.
Binomial Distribution
Binomial is an algebraic expression of the sum or the difference of two terms. Before knowing about binomial distribution, we must know about the binomial theorem.
Question 2 in images

2.
The hypotheses are given below:
Null hypothesis:
H0: There is no evidence that the data indicate a difference in the effectiveness of the various training programs.
Alternative hypothesis:
H1: There is evidence that the data indicate a difference in the effectiveness of the various training programs.
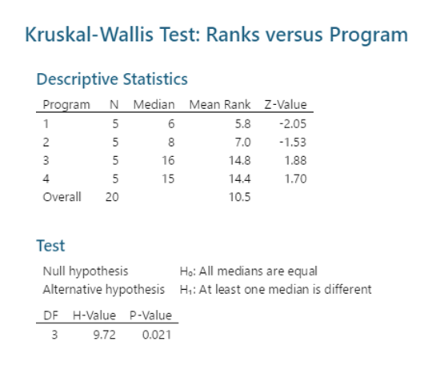
Step-by-step procedure to obtain the confidence interval using MINITAB software:
- Choose Stat > Nonparametrics > Kruskal-Wallis.
- In Response, enter the column of Ranks.
- In Factor, enter the column of
- Click OK in all the dialogue boxes.
Output obtained using MINITAB software is given below:

Step by step
Solved in 2 steps with 1 images


