Below is the stock price and dividend history for No-Cameras-Allowed Inc. (NCA), company organizing Las Vegas retreats for investment banks. Year Stock Price (end-of-year) Dividend (paid during the year) 2019 90 2020 180 18 2021 120 6. a. Compute the annual return in 2020 and 2021. b. Compute the arithmetic average return over the 2019–2021 period. c. Compute the geometric average return over the 2019–2021 period. d You bhuy 2. 000 obon
Below is the stock price and dividend history for No-Cameras-Allowed Inc. (NCA), company organizing Las Vegas retreats for investment banks. Year Stock Price (end-of-year) Dividend (paid during the year) 2019 90 2020 180 18 2021 120 6. a. Compute the annual return in 2020 and 2021. b. Compute the arithmetic average return over the 2019–2021 period. c. Compute the geometric average return over the 2019–2021 period. d You bhuy 2. 000 obon

Essentials Of Investments
11th Edition
ISBN:9781260013924
Author:Bodie, Zvi, Kane, Alex, MARCUS, Alan J.
Publisher:Bodie, Zvi, Kane, Alex, MARCUS, Alan J.
Chapter1: Investments: Background And Issues
Section: Chapter Questions
Problem 1PS

Related questions
Question

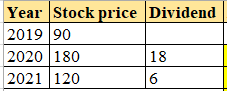
Transcribed Image Text:O Below is the stock price and dividend history for No-Cameras-Allowed Inc. (NCA), a
company organizing Las Vegas retreats for investment banks.
Stock Price (end-of-year)
Dividend (paid during the year)
Year
2019
90
180
18
2020
2021
120
6.
a. Compute the annual return in 2020 and 2021.
b. Compute the arithmetic average return over the 2019–2021 period.
c. Compute the geometric average return over the 2019–2021 period.
d. You buy 2,000 shares of NCA at the end of 2019 and hold them through the
end of 2021. You reinvest any dividends received (i.e., you use the dividend
proceeds to buy more shares of NCA). Except for reinvestment of dividends,
you neither buy nor sell any shares before the end of 2021.
Which average, arithmetic or geometric, better captures your investment
performance over the 2019–2021 period? Please provide a brief explanation for
your answer.
B Focus
MacBook Pro
Expert Solution
Given Details:
Honor Code:
Hi there, thanks for posting the questions. But as per our Q&A guidelines, we must answer the first three sub-parts when multiple questions posted under single question. Hence the answer for first three sub-parts provided below. Please repost the remaining subparts with complete question Information
Given Details:

Step by step
Solved in 3 steps with 3 images

Recommended textbooks for you
Essentials Of Investments
Finance
ISBN:
9781260013924
Author:
Bodie, Zvi, Kane, Alex, MARCUS, Alan J.
Publisher:
Mcgraw-hill Education,


Essentials Of Investments
Finance
ISBN:
9781260013924
Author:
Bodie, Zvi, Kane, Alex, MARCUS, Alan J.
Publisher:
Mcgraw-hill Education,

Foundations Of Finance
Finance
ISBN:
9780134897264
Author:
KEOWN, Arthur J., Martin, John D., PETTY, J. William
Publisher:
Pearson,

Fundamentals of Financial Management (MindTap Cou…
Finance
ISBN:
9781337395250
Author:
Eugene F. Brigham, Joel F. Houston
Publisher:
Cengage Learning

Corporate Finance (The Mcgraw-hill/Irwin Series i…
Finance
ISBN:
9780077861759
Author:
Stephen A. Ross Franco Modigliani Professor of Financial Economics Professor, Randolph W Westerfield Robert R. Dockson Deans Chair in Bus. Admin., Jeffrey Jaffe, Bradford D Jordan Professor
Publisher:
McGraw-Hill Education