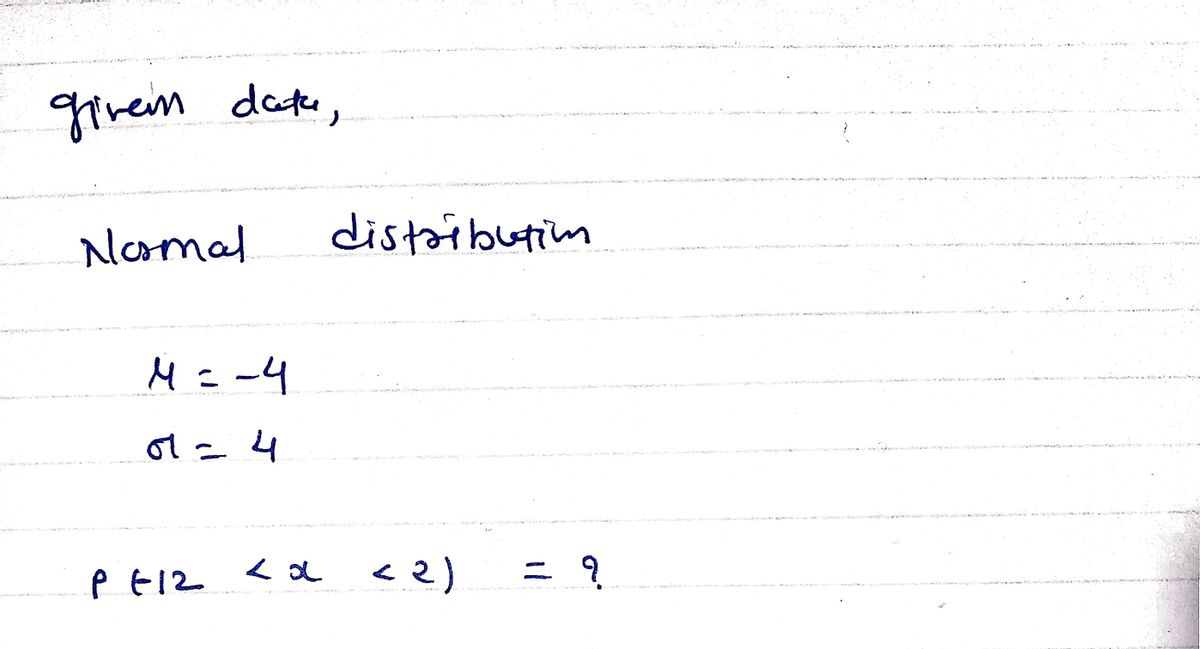
Below is a qgraph of a normal distribution with mean u 4 and standard deviation a =4. The shaded region represents the probability of obtaining a value from this distribution that is between 12 and 2. Shade the corresponding region under the standard normal curve helow. Explanation Check O 2022 McGraw HI LLC AI Rghts Rerved s of Use Privecy Certer to search 直
Below is a qgraph of a normal distribution with mean u 4 and standard deviation a =4. The shaded region represents the probability of obtaining a value from this distribution that is between 12 and 2. Shade the corresponding region under the standard normal curve helow. Explanation Check O 2022 McGraw HI LLC AI Rghts Rerved s of Use Privecy Certer to search 直
MATLAB: An Introduction with Applications
6th Edition
ISBN:9781119256830
Author:Amos Gilat
Publisher:Amos Gilat
Chapter1: Starting With Matlab
Section: Chapter Questions
Problem 1P
Related questions
Question

Transcribed Image Text:ALEKS -Data-Onven Decisions NX
A ALEKS - Chlorette Williams - Lear X
->
O https://www-awu.aleks.com/alekscgi/x/Isl.exe/1o_u-lgNslkr7j8P3jH-v-6txjbonmDn7WsVrRAXK6XnHkiRvH2tIBo1RdLW9Peg2eBeNg_rdIGA. Q ta
RANDOM VARIALES AND DISTRIBUTIONS
Normal versus standard normal curves
Chlorette y
s
Below is a graph of a normal distribution with mean u=-4 and standard deviation a =4. The shaded region represents the probability of obtaining a value
from this distribution that is between -12 and 2.
Shade the corresponding region under the standard normal curve below.
Explanation
Check
O 2022 McGraw HI LLC AlI Rights Reserved Terms of Use I Privecy Center| Accessibility
O Type here to search
(?)
27°F A O
hp
"ort se
delete
home
8
backspace
P
H KL
pause
alt
ett
Expert Solution
Step 1

Step by step
Solved in 2 steps with 2 images

Recommended textbooks for you

MATLAB: An Introduction with Applications
Statistics
ISBN:
9781119256830
Author:
Amos Gilat
Publisher:
John Wiley & Sons Inc

Probability and Statistics for Engineering and th…
Statistics
ISBN:
9781305251809
Author:
Jay L. Devore
Publisher:
Cengage Learning

Statistics for The Behavioral Sciences (MindTap C…
Statistics
ISBN:
9781305504912
Author:
Frederick J Gravetter, Larry B. Wallnau
Publisher:
Cengage Learning

MATLAB: An Introduction with Applications
Statistics
ISBN:
9781119256830
Author:
Amos Gilat
Publisher:
John Wiley & Sons Inc

Probability and Statistics for Engineering and th…
Statistics
ISBN:
9781305251809
Author:
Jay L. Devore
Publisher:
Cengage Learning

Statistics for The Behavioral Sciences (MindTap C…
Statistics
ISBN:
9781305504912
Author:
Frederick J Gravetter, Larry B. Wallnau
Publisher:
Cengage Learning

Elementary Statistics: Picturing the World (7th E…
Statistics
ISBN:
9780134683416
Author:
Ron Larson, Betsy Farber
Publisher:
PEARSON

The Basic Practice of Statistics
Statistics
ISBN:
9781319042578
Author:
David S. Moore, William I. Notz, Michael A. Fligner
Publisher:
W. H. Freeman

Introduction to the Practice of Statistics
Statistics
ISBN:
9781319013387
Author:
David S. Moore, George P. McCabe, Bruce A. Craig
Publisher:
W. H. Freeman