Beanie babies are toy stuffed animals that have become valuable collector’s items. Beanie World Magazine provided the age, retired status (R for Retired and C for Current), and value of 50 Beanie babies. The data Beanie can be downloaded from Blackboard. Answer the following questions using Minitab. a) Show the retired/current status of the 50 Beanie babies with pie chart and bar chart. b) What percentage of the age measurements actually fall into ¯x±s, ¯x±2s, and ¯x±3s. Compare your result with the empirical rule
Beanie babies are toy stuffed animals that have become valuable collector’s items. Beanie World Magazine provided the age, retired status (R for Retired and C for Current), and value of 50 Beanie babies. The data Beanie can be downloaded from Blackboard. Answer the following questions using Minitab.
a) Show the retired/current status of the 50 Beanie babies with pie chart and bar chart.
b) What percentage of the age measurements actually fall into ¯x±s, ¯x±2s, and ¯x±3s. Compare your result with the


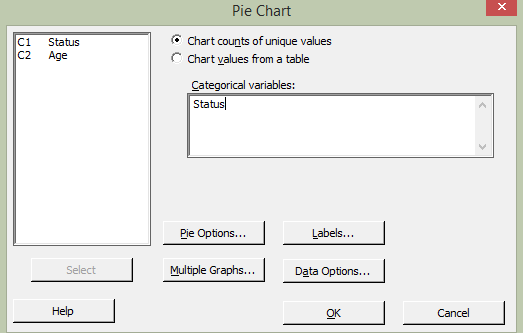
a) A pie chart for the retired or current status of the 50 Beanie babies is constructed using Minitab, using the following steps:
1) Put the variable Status in the sheet.
2) Select Graph-> Pie Chart...
3) Choose the variable required for the pie chart and click OK.

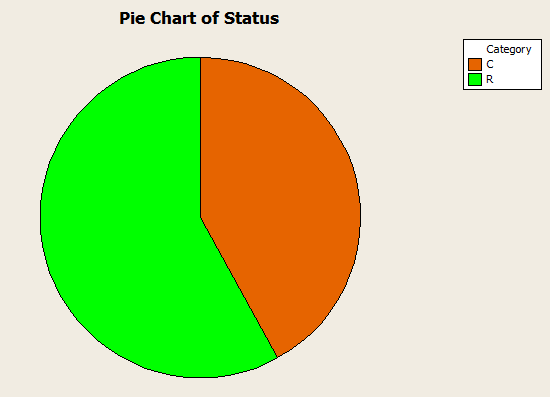
4) The pie chart is obtained as follows:

From the pie chart, it can be seen that there are more retired Beanie babies than the current ones.
Step by step
Solved in 5 steps with 9 images


