Based on the data shown below, calculate the regression line (each value to one decimal place) = 0.571 X y 3 19.36 4 18.48 5 21.4 19.52 67 6 8 9 10 22.34 22.36 20.58 23.9 X +
Based on the data shown below, calculate the regression line (each value to one decimal place) = 0.571 X y 3 19.36 4 18.48 5 21.4 19.52 67 6 8 9 10 22.34 22.36 20.58 23.9 X +

MATLAB: An Introduction with Applications
6th Edition
ISBN:9781119256830
Author:Amos Gilat
Publisher:Amos Gilat
Chapter1: Starting With Matlab
Section: Chapter Questions
Problem 1P

Related questions
Question
![Based on the data shown below, calculate the regression line (each value to one decimal place).
\[
\hat{y} = 0.571x + \_\_\_\_
\]
| x | y |
|----|------|
| 3 | 19.36 |
| 4 | 18.48 |
| 5 | 21.4 |
| 6 | 19.52 |
| 7 | 22.34 |
| 8 | 22.36 |
| 9 | 20.58 |
| 10 | 23.9 |
To calculate the regression line, you need to determine the slope and the y-intercept of the best fit line for the data points provided. The partial regression equation is given, with the slope as 0.571. The next step is to compute the y-intercept by solving the regression equation using the values from the table.](/v2/_next/image?url=https%3A%2F%2Fcontent.bartleby.com%2Fqna-images%2Fquestion%2F97b5df25-1667-438a-b46e-c2a0d1ae7c86%2Fa5580b9c-de2f-44d7-92b9-a6ff283f0077%2Fsqgm4d9_processed.jpeg&w=3840&q=75)
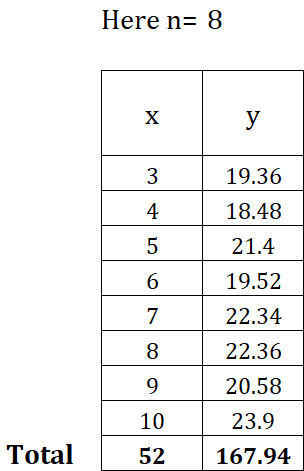
Transcribed Image Text:Based on the data shown below, calculate the regression line (each value to one decimal place).
\[
\hat{y} = 0.571x + \_\_\_\_
\]
| x | y |
|----|------|
| 3 | 19.36 |
| 4 | 18.48 |
| 5 | 21.4 |
| 6 | 19.52 |
| 7 | 22.34 |
| 8 | 22.36 |
| 9 | 20.58 |
| 10 | 23.9 |
To calculate the regression line, you need to determine the slope and the y-intercept of the best fit line for the data points provided. The partial regression equation is given, with the slope as 0.571. The next step is to compute the y-intercept by solving the regression equation using the values from the table.
Expert Solution
Step 1

Step by step
Solved in 3 steps with 4 images

Recommended textbooks for you
MATLAB: An Introduction with Applications
Statistics
ISBN:
9781119256830
Author:
Amos Gilat
Publisher:
John Wiley & Sons Inc

Probability and Statistics for Engineering and th…
Statistics
ISBN:
9781305251809
Author:
Jay L. Devore
Publisher:
Cengage Learning

Statistics for The Behavioral Sciences (MindTap C…
Statistics
ISBN:
9781305504912
Author:
Frederick J Gravetter, Larry B. Wallnau
Publisher:
Cengage Learning
MATLAB: An Introduction with Applications
Statistics
ISBN:
9781119256830
Author:
Amos Gilat
Publisher:
John Wiley & Sons Inc
Probability and Statistics for Engineering and th…
Statistics
ISBN:
9781305251809
Author:
Jay L. Devore
Publisher:
Cengage Learning
Statistics for The Behavioral Sciences (MindTap C…
Statistics
ISBN:
9781305504912
Author:
Frederick J Gravetter, Larry B. Wallnau
Publisher:
Cengage Learning

Elementary Statistics: Picturing the World (7th E…
Statistics
ISBN:
9780134683416
Author:
Ron Larson, Betsy Farber
Publisher:
PEARSON

The Basic Practice of Statistics
Statistics
ISBN:
9781319042578
Author:
David S. Moore, William I. Notz, Michael A. Fligner
Publisher:
W. H. Freeman

Introduction to the Practice of Statistics
Statistics
ISBN:
9781319013387
Author:
David S. Moore, George P. McCabe, Bruce A. Craig
Publisher:
W. H. Freeman