(b) You sample 25 students. What is the standard deviation of the sampling distribution of their average score x¯ ? (Enter your answer rounded to two decimal places.)
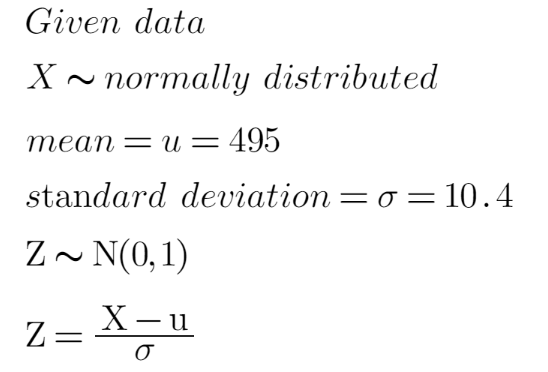
Almost all medical schools in the United States require students to take the Medical College Admission Test (MCAT). To estimate the mean score μ of those who took the MCAT on your campus, you will obtain the scores of an SRS of students. The scores follow a
(a) If you choose one student at random, what is the probability that the student's score is between 490 and 500? Use Table A, or software to calculate your answer.
(Enter your answer rounded to four decimal places.)
![TABLES
697
Table entry
Table entry for z is the area under the
standard Normal curve to the left of z.
TABLE A Standard Normal cumulative proportions (continued)
.00
.01
.02
.03
.04
.05
.06
.07
.08
.09
0.0
.5000
.5040
.5080
.5120
.5160
.5199
.5239
.5279
.5319
.5359
.5557
.5948
.6331
.5636
.6026
0.1
.5398
.5438
.5478
.5517
.5596
.5675
.5714
.5753
0.2
.5793
.5832
.5871
.5910
.5987
.6064
.6103
.6141
0.3
0.4
.6406
.6772
.6480
.6844
.6179
.6217
.6255
.6293
.6368
.6443
.6517
.6554
.6591
.6628
.6664
.6700
.6736
.6808
.6879
.6950
.7054
.7389
.7088
.7422
.7123
.7454
.7764
0.5
.6915
.6985
.7019
.7157
.7190
.7224
0.6
.7257
.7580
.7517
.7823
.8106
.7291
.7324
.7357
.7486
.7794
.8078
.8340
.7549
0.7
.7611
.7642
.7673
.7704
.7734
.7852
.8023
.8289
0.8
.7881
.7910
.7939
.7967
.7995
.8051
.8133
0.9
.8159
.8186
.8212
.8238
.8264
.8315
.8365
.8389
.8485
.8708
.8907
.8508
.8577
.8790
1.0
.8413
.8438
.8461
.8531
.8554
.8599
.8621
.8643
.8849
.8749
.8944
1.1
.8665
.8686
.8729
.8770
.8810
.8830
1.2
.8869
.8888
.8925
.8962
.8980
.8997
.9015
1.3
.9032
.9049
.9066
.9082
.9099
.9115
.9131
.9147
.9162
.9177
1.4
.9192
.9207
.9222
.9236
.9251
.9265
.9279
.9292
.9306
.9319
1.5
.9332
.9345
.9357
.9370
.9382
.9394
.9406
.9418
.9429
.9441
.9463
.9564
1.6
.9452
.9474
.9484
.9495
.9505
.9515
.9525
.9535
.9545
1.7
.9554
.9573
.9582
.9591
.9599
.9608
.9616
.9625
.9633
.9678
.9744
1.8
.9641
.9649
.9656
.9664
.9671
.9686
.9693
.9699
.9706
1.9
.9713
.9719
.9726
.9732
.9738
.9750
.9756
.9761
.9767
2.0
.9772
.9778
.9783
.9788
.9793
.9798
.9803
.9808
.9812
.9817
2.1
.9821
.9826
.9830
.9834
.9838
.9842
.9846
.9850
.9854
.9887
.9913
.9857
2.2
.9861
.9864
.9868
.9871
.9875
.9878
.9881
.9884
.9890
2.3
.9893
.9896
.9898
.9901
.9904
.9906
.9909
.9911
.9916
2.4
.9918
.9920
.9922
.9925
.9927
.9929
.9931
.9932
.9934
.9936
2.5
.9938
.9940
.9941
.9943
.9945
.9946
.9948
.9949
.9951
.9952
2.6
.9953
.9955
.9956
.9957
.9959
.9960
.9961
.9962
.9963
.9964
2.7
.9965
.9966
.9967
.9968
.9969
.9970
.9971
.9972
.9973
.9974
.9977
.9983
2.8
.9974
.9975
.9976
.9977
.9978
.9979
.9979
.9980
.9981
2.9
.9981
.9982
.9982
.9984
.9984
.9985
.9985
9986
.9986
3.0
.9987
.9987
.9987
.9988
9988
.9989
.9989
.9989
.9990
.9990
3.1
.9990
.9991
.9991
.9991
.9992
.9992
.9992
.9992
.9993
.9993
3.2
.9993
.9993
.9994
.9994
.9994
.9994
.9994
.9996
.9995
.9995
.9995
3.3
.9995
.9995
.9995
.9996
.9996
.9996
.9996
.9996
.9997
3.4
.9997
.9997
.9997
.9997
.9997
.9997
.9997
.9997
.9997
.9998](/v2/_next/image?url=https%3A%2F%2Fcontent.bartleby.com%2Fqna-images%2Fquestion%2Fc38f1e5e-525c-46d4-a67d-f9f323a8f4ce%2F31e51b42-aefd-4178-ab54-62833348ea2b%2Futciilg_processed.png&w=3840&q=75)
![696
TABLES
Table entry for z is the area under the
Table entry
standard Normal curve to the left of z.
TABLE A Standard normal cumulative proportions
.00
.01
.02
.03
.04
.05
.06
.07
.08
.09
-3.4
.0003
.0003
.0003
.0003
.0003
.0003
.0003
.0003
.0003
.0002
.0003
.0005
.0007
.0005
.0004
.0006
-3.3
.0005
.0005
.0004
.0004
.0004
.0004
.0004
-3.2
.0007
.0007
.0006
.0006
.0006
.0006
.0005
.0005
-3.1
.0010
.0009
.0009
.0009
.0008
.0008
.0008
.0008
.0007
-3.0
.0013
.0013
.0013
.0012
.0012
.0011
.0011
.0011
.0010
.0010
-2.9
.0019
.0018
.0018
.0017
.0016
.0016
.0015
.0015
.0014
.0014
.0023
.0032
-2.8
.0026
.0025
.0024
.0023
.0022
.0021
.0021
.0020
.0019
-2.7
.0035
.0034
.0033
.0031
.0030
.0029
.0028
.0027
.0026
-2.6
.0047
.0045
.0044
.0043
.0041
.0040
.0054
.0039
.0038
.0037
.0036
-2.5
.0062
.0060
.0059
.0057
.0055
.0052
.0051
.0049
.0048
-2.4
.0064
.0084
.0082
.0080
.0078
.0075
.0073
.0071
.0069
.0068
.0066
-2.3
.0107
.0104
.0102
.0099
.0096
.0094
.0091
.0089
.0087
-2.2
.0139
.0136
.0132
.0129
.0125
.0122
.0119
.0116
.0113
.0110
.0174
.0222
.0170
.0217
-2.1
.0179
.0166
.0162
.0158
.0154
.0150
.0146
.0143
-2.0
.0228
.0212
.0207
.0202
.0197
.0192
.0188
.0183
.0274
.0287
.0359
.0281
.0268
.0262
.0256
.0250
.0233
.0244
.0307
.0384
-1.9
.0239
.0314
- 1.8
- 1.7
.0336
.0418
.0516
.0329
.0409
.0351
.0344
.0322
.0301
.0294
.0446
.0436
.0427
.0401
.0392
.0375
.0367
.0485
.0505
.0618
.0455
.0548
.0668
-1.6
.0537
.0526
.0495
.0475
.0465
-1.5
.0655
.0643
.0630
.0606
.0594
.0582
.0571
.0559
-1.4
-1.3
.0694
.0838
.0808
.0793
.0778
.0764
.0749
.0735
.0721
.0708
.0681
.0968
.0951
.0934
.0918
.0901
.0885
.0869
.0853
.0823
- 1.2
- 1.1
.1038
.1230
.1151
.1131
.1112
.1093
.1075
.1056
.1020
.1003
.0985
.1357
.1335
.1314
.1292
.1271
.1251
.1210
.1190
.1170
-1.0
.1587
.1562
.1539
.1515
.1492
.1469
.1446
.1423
.1401
.1379
.1814
.2090
-0.9
.1841
.1788
.1762
.1736
.1711
.1685
.1660
.1635
.1611
-0.8
.2119
.2061
.2033
.2005
.1977
.1949
.1922
.1894
.1867
-0.7
.2420
.2389
.2358
.2327
.2296
.2266
.2236
.2206
.2177
.2148
-0.6
.2743
.2709
.2676
.2643
.2611
.2578
.2546
.2514
.2483
.2451
-0.5
3085
3050
.3015
.2981
.2946
.2912
.2877
.2843
.2810
.2776
.3409
.3783
.4168
-0.4
.3446
.3372
.3336
3300
.3264
.3228
.3192
.3156
.3121
-0.3
.3821
.3745
3707
.3669
.3632
.3594
.3557
3520
.3483
.4090
.4483
.4880
-0.2
.4207
.4129
.4052
.4013
.3974
.3936
.3897
.3859
.4404
.4801
.4247
.4641
-0.1
.4602
.4562
.4522
.4443
.4364
.4325
.4286
-0.0
.5000
.4960
.4920
.4840
.4761
.4721
.4681](/v2/_next/image?url=https%3A%2F%2Fcontent.bartleby.com%2Fqna-images%2Fquestion%2Fc38f1e5e-525c-46d4-a67d-f9f323a8f4ce%2F31e51b42-aefd-4178-ab54-62833348ea2b%2Fxveehvr_processed.png&w=3840&q=75)
![](/static/compass_v2/shared-icons/check-mark.png)
Trending now
This is a popular solution!
Step by step
Solved in 3 steps with 5 images
![Blurred answer](/static/compass_v2/solution-images/blurred-answer.jpg)
![MATLAB: An Introduction with Applications](https://www.bartleby.com/isbn_cover_images/9781119256830/9781119256830_smallCoverImage.gif)
![Probability and Statistics for Engineering and th…](https://www.bartleby.com/isbn_cover_images/9781305251809/9781305251809_smallCoverImage.gif)
![Statistics for The Behavioral Sciences (MindTap C…](https://www.bartleby.com/isbn_cover_images/9781305504912/9781305504912_smallCoverImage.gif)
![Elementary Statistics: Picturing the World (7th E…](https://www.bartleby.com/isbn_cover_images/9780134683416/9780134683416_smallCoverImage.gif)
![The Basic Practice of Statistics](https://www.bartleby.com/isbn_cover_images/9781319042578/9781319042578_smallCoverImage.gif)
![Introduction to the Practice of Statistics](https://www.bartleby.com/isbn_cover_images/9781319013387/9781319013387_smallCoverImage.gif)