What type of pattern exists in the data? O The time series plot shows a trend pattern with no seasonal pattern present. The time series plot shows a horizontal pattern, but there is also a seasonal pattern in the data.
What type of pattern exists in the data? O The time series plot shows a trend pattern with no seasonal pattern present. The time series plot shows a horizontal pattern, but there is also a seasonal pattern in the data.

MATLAB: An Introduction with Applications
6th Edition
ISBN:9781119256830
Author:Amos Gilat
Publisher:Amos Gilat
Chapter1: Starting With Matlab
Section: Chapter Questions
Problem 1P

Related questions
Question

Transcribed Image Text:A statistical program is recommended.
Consider the following time series.
Quarter Year 1
1
2
3
4
70
50
58
77
Year 2
67
42
60
80
Year 3
61
52
53
71

Transcribed Image Text:What type of pattern exists in the data?
The time series plot shows a trend pattern with no seasonal pattern present.
The time series plot shows a horizontal pattern, but there is also a seasonal pattern in the data.
The time series plot shows a horizontal pattern with no seasonal pattern present.
The time series plot shows a trend pattern, but there is also a seasonal pattern in the data.
(b) Use the following dummy variables to develop an estimated regression equation to account for seasonal effects in the data:
=
= 1 if quarter 2, 0 otherwise; X3 1 if quarter 3, 0 otherwise.
ŷ =
X1 = 1 if quarter 1, 0 otherwise; X₂
(c) Compute the quarterly forecasts for next year.
quarter 1 forecast
quarter 2 forecast
quarter 3 forecast
quarter 4 forecast
Expert Solution
Step 1
Type of pattern:
Excel Procedure:
- Enter the time series values and quarter values in Excel.
- Select the column of time series values in excel.
- Go to insert.
- Go to insert statistic chart.
- click on ‘line chart’.
Excel Output:
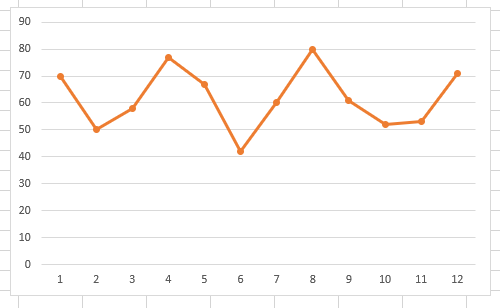
Correct option is option 3
From the scatter plot, there is no horizontal in the data values.
That is, there exists a trend(increasing and decreasing) with seasonality.
Correct option:
The time series plot shows a trend pattern, but there is also a seasonal pattern in the data.

Step by step
Solved in 3 steps with 8 images

Follow-up Questions
Read through expert solutions to related follow-up questions below.
Follow-up Question
Solution is incorrect, can it be revised again please?
![**(b)** Use the following dummy variables to develop an estimated regression equation to account for seasonal effects in the data:
\[ x_1 = 1 \text{ if quarter 1, 0 otherwise; } x_2 = 1 \text{ if quarter 2, 0 otherwise; } x_3 = 1 \text{ if quarter 3, 0 otherwise.} \]
\[ \hat{y} = 80.5 - 0.5625t - 11.6875x_1 - 29.125x_2 - 19.5625x_3 \] (incorrect)
**(c)** Compute the quarterly forecasts for next year.
- Quarter 1 forecast: 62 ❌
- Quarter 2 forecast: 44 ❌
- Quarter 3 forecast: 53 ❌
- Quarter 4 forecast: 72 ❌](https://content.bartleby.com/qna-images/question/e2fdea76-24b5-4e92-ab93-0d275ab88ec3/36dd5291-212d-4ce6-bd92-87f843a73342/5dpa3i8_processed.png)
Transcribed Image Text:**(b)** Use the following dummy variables to develop an estimated regression equation to account for seasonal effects in the data:
\[ x_1 = 1 \text{ if quarter 1, 0 otherwise; } x_2 = 1 \text{ if quarter 2, 0 otherwise; } x_3 = 1 \text{ if quarter 3, 0 otherwise.} \]
\[ \hat{y} = 80.5 - 0.5625t - 11.6875x_1 - 29.125x_2 - 19.5625x_3 \] (incorrect)
**(c)** Compute the quarterly forecasts for next year.
- Quarter 1 forecast: 62 ❌
- Quarter 2 forecast: 44 ❌
- Quarter 3 forecast: 53 ❌
- Quarter 4 forecast: 72 ❌

Transcribed Image Text:A statistical program is recommended.
Consider the following time series.
| Quarter | Year 1 | Year 2 | Year 3 |
|---------|--------|--------|--------|
| 1 | 70 | 67 | 61 |
| 2 | 50 | 42 | 52 |
| 3 | 58 | 60 | 53 |
| 4 | 77 | 80 | 71 |
This table presents a time series data set across three years, divided into four quarters. Each cell shows a numerical value, which represents the observed data in each corresponding quarter for each year.
Solution
Recommended textbooks for you
MATLAB: An Introduction with Applications
Statistics
ISBN:
9781119256830
Author:
Amos Gilat
Publisher:
John Wiley & Sons Inc

Probability and Statistics for Engineering and th…
Statistics
ISBN:
9781305251809
Author:
Jay L. Devore
Publisher:
Cengage Learning

Statistics for The Behavioral Sciences (MindTap C…
Statistics
ISBN:
9781305504912
Author:
Frederick J Gravetter, Larry B. Wallnau
Publisher:
Cengage Learning
MATLAB: An Introduction with Applications
Statistics
ISBN:
9781119256830
Author:
Amos Gilat
Publisher:
John Wiley & Sons Inc
Probability and Statistics for Engineering and th…
Statistics
ISBN:
9781305251809
Author:
Jay L. Devore
Publisher:
Cengage Learning
Statistics for The Behavioral Sciences (MindTap C…
Statistics
ISBN:
9781305504912
Author:
Frederick J Gravetter, Larry B. Wallnau
Publisher:
Cengage Learning

Elementary Statistics: Picturing the World (7th E…
Statistics
ISBN:
9780134683416
Author:
Ron Larson, Betsy Farber
Publisher:
PEARSON

The Basic Practice of Statistics
Statistics
ISBN:
9781319042578
Author:
David S. Moore, William I. Notz, Michael A. Fligner
Publisher:
W. H. Freeman

Introduction to the Practice of Statistics
Statistics
ISBN:
9781319013387
Author:
David S. Moore, George P. McCabe, Bruce A. Craig
Publisher:
W. H. Freeman