(b) Test for a significant relationship using the F test. Use a = 0.05. State the null and alternative hypotheses. O Ho: B₁ 20 H₂: B₁ <0 O Ho: B₁ #0 H₂: B₁ = 0 OHO: Bo #0 H₂: B₁ = 0 o Ho: Bo=0 H₂: B=0 ⒸH₁: B₁ = 0 H₂: B₁ * 0 Find the value of the test statistic. (Round your answer to two decimal places.) 2.788108 Find the p-value. (Round your answer to three decimal places.)
(b) Test for a significant relationship using the F test. Use a = 0.05. State the null and alternative hypotheses. O Ho: B₁ 20 H₂: B₁ <0 O Ho: B₁ #0 H₂: B₁ = 0 OHO: Bo #0 H₂: B₁ = 0 o Ho: Bo=0 H₂: B=0 ⒸH₁: B₁ = 0 H₂: B₁ * 0 Find the value of the test statistic. (Round your answer to two decimal places.) 2.788108 Find the p-value. (Round your answer to three decimal places.)

MATLAB: An Introduction with Applications
6th Edition
ISBN:9781119256830
Author:Amos Gilat
Publisher:Amos Gilat
Chapter1: Starting With Matlab
Section: Chapter Questions
Problem 1P

Related questions
Question

Transcribed Image Text:### Statistical Analysis Using F Test
#### (b) Test for a Significant Relationship Using the F Test (α = 0.05)
**Null and Alternative Hypotheses:**
- \( H_0: \, \beta_1 = 0 \)
- \( H_a: \, \beta_1 \neq 0 \) (This hypothesis is selected)
**Test Statistic:**
- The calculated test statistic value is **2.79**.
**p-value:**
- The calculated p-value is **0.049**.
**Conclusion:**
- **Reject \( H_0 \)**: We conclude that the relationship between price ($) and overall score is significant.
#### (c) ANOVA Table
This section presents the ANOVA (Analysis of Variance) table summarizing the variance analysis for the data.
| Source of Variation | Sum of Squares | Degrees of Freedom | Mean Square | F | p-value |
|---------------------|----------------|-------------------|-------------|---------|------------|
| Regression | 1537.93 | 1 | 1537.93 | 20.78 | 0.010 |
| Error | 296.07 | 4 | 74.02 | | |
| Total | 1834 | 5 | | | |
- The F-value is **20.78** with a p-value of **0.010** which supports rejecting the null hypothesis, indicating a significant relationship between the variables.
![### Analysis of Stereo Headphone Prices and Overall Scores
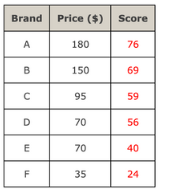
#### Data Table
The table below shows the price ($) and overall score for six stereo headphones tested by a magazine. The overall score considers sound quality and noise reduction on a scale from 0 (lowest) to 100 (highest).
| Brand | Price ($) | Score |
|-------|-----------|-------|
| A | 180 | 76 |
| B | 150 | 69 |
| C | 95 | 59 |
| D | 70 | 56 |
| E | 40 | 40 |
| F | 35 | 24 |
#### Regression Analysis
**Estimated Regression Equation:**
\[
\hat{y} = 21.926421 + 0.320736x
\]
Where \(x\) is the price in dollars, and \(y\) is the overall score.
The regression equation suggests that as the price of headphones increases, the overall score tends to increase.
#### Hypothesis Testing
We are using a significance level (\(\alpha\)) of 0.05 to test if there is a significant relationship between price and overall score.
**Null and Alternative Hypotheses:**
We are testing:
- \(H_0: \beta_1 = 0\) (No relationship between price and score)
- \(H_a: \beta_1 \neq 0\) (There is a relationship between price and score)
From the options provided, the correct hypothesis set selected indicates:
- \(H_0: \beta_1 = 0\)
- \(H_a: \beta_1 \neq 0\)
**Test Statistic and p-value:**
- **Test Statistic:** 4.558263
- **p-value:** 0.010352
#### Conclusion
Based on the p-value:
- **Reject \(H_0\):** Since the p-value (0.010352) is less than the significance level (0.05), we reject the null hypothesis.
- **Conclusion:** There is a statistically significant relationship between the price of headphones and their overall score.
This analysis indicates that as the price increases, there tends to be an improvement in the overall quality as measured by the score.](/v2/_next/image?url=https%3A%2F%2Fcontent.bartleby.com%2Fqna-images%2Fquestion%2Ff7b76bbb-1122-4c75-9c9e-2038b7c47d4e%2Fc6da0e3b-10b9-4e29-af72-19f060b43ae0%2Fg3s8aah_processed.png&w=3840&q=75)
Transcribed Image Text:### Analysis of Stereo Headphone Prices and Overall Scores
#### Data Table
The table below shows the price ($) and overall score for six stereo headphones tested by a magazine. The overall score considers sound quality and noise reduction on a scale from 0 (lowest) to 100 (highest).
| Brand | Price ($) | Score |
|-------|-----------|-------|
| A | 180 | 76 |
| B | 150 | 69 |
| C | 95 | 59 |
| D | 70 | 56 |
| E | 40 | 40 |
| F | 35 | 24 |
#### Regression Analysis
**Estimated Regression Equation:**
\[
\hat{y} = 21.926421 + 0.320736x
\]
Where \(x\) is the price in dollars, and \(y\) is the overall score.
The regression equation suggests that as the price of headphones increases, the overall score tends to increase.
#### Hypothesis Testing
We are using a significance level (\(\alpha\)) of 0.05 to test if there is a significant relationship between price and overall score.
**Null and Alternative Hypotheses:**
We are testing:
- \(H_0: \beta_1 = 0\) (No relationship between price and score)
- \(H_a: \beta_1 \neq 0\) (There is a relationship between price and score)
From the options provided, the correct hypothesis set selected indicates:
- \(H_0: \beta_1 = 0\)
- \(H_a: \beta_1 \neq 0\)
**Test Statistic and p-value:**
- **Test Statistic:** 4.558263
- **p-value:** 0.010352
#### Conclusion
Based on the p-value:
- **Reject \(H_0\):** Since the p-value (0.010352) is less than the significance level (0.05), we reject the null hypothesis.
- **Conclusion:** There is a statistically significant relationship between the price of headphones and their overall score.
This analysis indicates that as the price increases, there tends to be an improvement in the overall quality as measured by the score.
Expert Solution
Step 1: Solution
Given :

Step by step
Solved in 5 steps with 8 images

Recommended textbooks for you
MATLAB: An Introduction with Applications
Statistics
ISBN:
9781119256830
Author:
Amos Gilat
Publisher:
John Wiley & Sons Inc

Probability and Statistics for Engineering and th…
Statistics
ISBN:
9781305251809
Author:
Jay L. Devore
Publisher:
Cengage Learning

Statistics for The Behavioral Sciences (MindTap C…
Statistics
ISBN:
9781305504912
Author:
Frederick J Gravetter, Larry B. Wallnau
Publisher:
Cengage Learning
MATLAB: An Introduction with Applications
Statistics
ISBN:
9781119256830
Author:
Amos Gilat
Publisher:
John Wiley & Sons Inc
Probability and Statistics for Engineering and th…
Statistics
ISBN:
9781305251809
Author:
Jay L. Devore
Publisher:
Cengage Learning
Statistics for The Behavioral Sciences (MindTap C…
Statistics
ISBN:
9781305504912
Author:
Frederick J Gravetter, Larry B. Wallnau
Publisher:
Cengage Learning

Elementary Statistics: Picturing the World (7th E…
Statistics
ISBN:
9780134683416
Author:
Ron Larson, Betsy Farber
Publisher:
PEARSON

The Basic Practice of Statistics
Statistics
ISBN:
9781319042578
Author:
David S. Moore, William I. Notz, Michael A. Fligner
Publisher:
W. H. Freeman

Introduction to the Practice of Statistics
Statistics
ISBN:
9781319013387
Author:
David S. Moore, George P. McCabe, Bruce A. Craig
Publisher:
W. H. Freeman