Astudy was done on proctored and nonproctored tests. The results are shown in the table. Assume that the two samples are independent simple random samples selected from normally distributed populations, and do not assume that the population standard deviations are equal. Complete parts (a) and (b) below.


(a). Test whether the students taking non-proctored tests get a higher mean score than those taking proctored tests:
Given data represents the descriptive statistics of test results of proctored students and non-proctored students.
The investigator is specially interested to test whether the students taking non-proctored tests get a higher mean score than those taking proctored tests.
Denote µ1 as the population mean test score of proctored students and µ2 as the population mean test score of non-proctored students.
The null and alternate hypotheses are stated below:
Null hypothesis H0:
H0: µ1 = µ2
That is, there is no significant difference in the mean test score of proctored students and non-proctored students.
Alternative hypothesis H1:
H1: µ1 < µ2 (Left tailed test)
That is, the mean test score of proctored students is significantly less than the mean test score of non-proctored students.
Test statistic and P-value:
2-sample t-test can be performed using TI-83 Plus calculator:
Software Procedure:
The step-by-step procedure to perform 2 sample t-test using TI-83 plus calculator is given below:
- Click on the ON
- Choose STAT > TESTS > 4: 2-SampleTTest… > ENTER.
- In Input select
- Input x1-bar = 75.49, sx1 = 11.84, n1 = 35 and x2-bar = 82.04, sx2 = 21.54, n2 = 32.
- Select µ1 : < µ2.
- In Pooled select
- Click on Calculate.
- Click on ENTER.
The output is shown below:
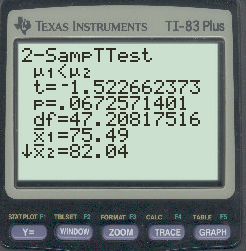
From the obtained output, the test statistic value is t = -1.52 and the P-value is P-value = 0.067.
Conclusion:
Here, the level of significance is α = 0.01.
Decision rule based on P-value approach:
If P-value ≤ α, then reject the null hypothesis H0.
If P-value > α, then fail to reject the null hypothesis H0.
Conclusion based on P-value approach:
The P-value is 0.067 and α value is 0.01.
Here, P-value is greater than the α value.
That is, 0.001 (=P-value) > 0.01 (=α).
By the rejection rule, fail to reject the null hypothesis.
Thus, there is no significant difference in the mean test score of proctored students and non-proctored students.
Fail to reject H0. There is not sufficient evidence to support the claim that students taking non-proctored tests get a higher mean score than those taking proctored tests.

Step by step
Solved in 3 steps with 2 images


