Assume that women's heights have a distribution that is symmetric and unimodal, with a mean of 64 inches, and the standard deviation is 2.5 inches. Assume that men's heights have a distribution that is symmetric and unimodal, with mean of 73 inches and a standard deviation of 2 inches.
Assume that women's heights have a distribution that is symmetric and unimodal, with a mean of 64 inches, and the standard deviation is 2.5 inches. Assume that men's heights have a distribution that is symmetric and unimodal, with mean of 73 inches and a standard deviation of 2 inches.

MATLAB: An Introduction with Applications
6th Edition
ISBN:9781119256830
Author:Amos Gilat
Publisher:Amos Gilat
Chapter1: Starting With Matlab
Section: Chapter Questions
Problem 1P

Related questions
Question
Assume that women's heights have a distribution that is symmetric and unimodal, with a mean of
64
inches, and the standard deviation is
2.5
inches. Assume that men's heights have a distribution that is symmetric and unimodal, with mean of
73
inches and a standard deviation of
2
inches.a. What women's height corresponds to a z-score of
−1.80?
b. Professional basketball player Evelyn Akhator is 75 inches tall and plays in the WNBA (women's league). Professional basketball player Draymond Green is 79 inches tall and plays in the NBA (men's league). Compared to his or her peers, who is taller?

Transcribed Image Text:Movie adjusted domestic gross
Adjusted Domestic Gross
($ millions)
Movie
The Dark Knight (2008)
$643
Batman (1989)
$547
Superman (1978)
$543
The Dark Knight Rises (2012)
$487
Wonder Woman (2017)
$407
Batman Forever (1995)
$366
Superman II (1981)
$346

Transcribed Image Text:The top seven movies based on DC comic book characters for the U.S. box office as of fall 2017 are shown in the accompanying table, rounded to the nearest million. Complete parts (a) through (c) below.
Click the icon to view the adjusted domestic gross for the top seven movies.
...
a. Find and interpret the median in context. Select the correct choice below and fill in the answer box within your choice.
(Type an integer or a decimal. Do not round.)
O A. The median is
million dollars. This means that about 25% of the top 7 DC movies made more than this much money.
B. The median is
million dollars. This means that about 50% of the top 7 DC movies made more than this much money.
C. The median is
million dollars. This means that about 75% of the top 7 DC movies made more than this much money.
D. The median is
million dollars. This means that none of the top 7 DC movies made more than this much money.
b. Find and interpret the IQR in context.
IQR =
million dollars
(Type an integer or a decimal. Do not round.)
Interpret the interquartile range in context. Choose the correct answer below.
O A. The top 7 DC movies had domestic grosses that varied by as much as this value.
B. This value is the mean domestic gross of the top 7 DC movies.
C. The middle 50% of the top 7 DC movies had domestic grosses that varied by as much as this value.
D. This value is the difference between the maximum and minimum domestic grosses of the top 7 DC movies.
c. Find the range of the data. Explain why the IQR is preferred over the range as a measure of variability.
Range =
million dollars
(Type an integer or a decimal. Do not round.)
Explain why the IQR is preferred over the range as a measure of variability. Choose the correct answer below.
A. The IQR depends on many observations and is therefore more reliable.
B. The IQR depends on a single observation, and is therefore more reliable.
C. The IQR depends on only two observations, the largest and the smallest, and is therefore more reliable.
O D. The IQR depends on only two observations, the mean and the median, and is therefore more reliable.
Expert Solution
Step 1
As per the multiple questions rule, answering first question. Please repost the second question separately
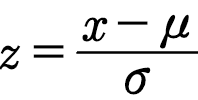
The formula to compute the z score is,

Trending now
This is a popular solution!

Step by step
Solved in 4 steps with 6 images

Recommended textbooks for you
MATLAB: An Introduction with Applications
Statistics
ISBN:
9781119256830
Author:
Amos Gilat
Publisher:
John Wiley & Sons Inc

Probability and Statistics for Engineering and th…
Statistics
ISBN:
9781305251809
Author:
Jay L. Devore
Publisher:
Cengage Learning

Statistics for The Behavioral Sciences (MindTap C…
Statistics
ISBN:
9781305504912
Author:
Frederick J Gravetter, Larry B. Wallnau
Publisher:
Cengage Learning
MATLAB: An Introduction with Applications
Statistics
ISBN:
9781119256830
Author:
Amos Gilat
Publisher:
John Wiley & Sons Inc
Probability and Statistics for Engineering and th…
Statistics
ISBN:
9781305251809
Author:
Jay L. Devore
Publisher:
Cengage Learning
Statistics for The Behavioral Sciences (MindTap C…
Statistics
ISBN:
9781305504912
Author:
Frederick J Gravetter, Larry B. Wallnau
Publisher:
Cengage Learning

Elementary Statistics: Picturing the World (7th E…
Statistics
ISBN:
9780134683416
Author:
Ron Larson, Betsy Farber
Publisher:
PEARSON

The Basic Practice of Statistics
Statistics
ISBN:
9781319042578
Author:
David S. Moore, William I. Notz, Michael A. Fligner
Publisher:
W. H. Freeman

Introduction to the Practice of Statistics
Statistics
ISBN:
9781319013387
Author:
David S. Moore, George P. McCabe, Bruce A. Craig
Publisher:
W. H. Freeman