Assume that the readings at freezing on a batch of thermometers are normally distributed with a mean of 0O°C and a standard deviation of 1.00°C. A single thermometer is randomly selected and tested. Find the probability of obtaining a reading less than -0.24 C. Shade: Left of a value Click and drag the arrows to adjust the values. 3.
Assume that the readings at freezing on a batch of thermometers are normally distributed with a mean of 0O°C and a standard deviation of 1.00°C. A single thermometer is randomly selected and tested. Find the probability of obtaining a reading less than -0.24 C. Shade: Left of a value Click and drag the arrows to adjust the values. 3.

MATLAB: An Introduction with Applications
6th Edition
ISBN:9781119256830
Author:Amos Gilat
Publisher:Amos Gilat
Chapter1: Starting With Matlab
Section: Chapter Questions
Problem 1P

Related questions

Question
![**Problem Statement:**
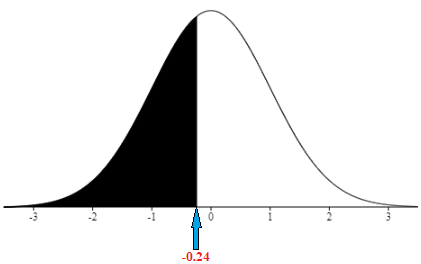
Assume that the readings at freezing on a batch of thermometers are normally distributed with a mean of 0°C and a standard deviation of 1.00°C. A single thermometer is randomly selected and tested. Find the probability of obtaining a reading less than -0.24°C.
**Interactive Element:**
- **Shade Option:** Left of a value
- **Instruction:** Click and drag the arrows to adjust the values.
**Graph Description:**
The graph shown is a normal distribution curve representing the standard normal distribution with a mean of 0.
- The x-axis ranges from -4 to 4.
- A blue shaded area under the curve extends to the left of -0.24°C.
- The shading highlights the probability of obtaining a reading less than the selected value.
- An arrow is pointing to -0.24 on the x-axis, indicating the critical value for this probability calculation.
**Mathematical Equation:**
\[ P(x < -0.24°C) = P(z < -0.24) = \text{(probability value to be calculated)} \]
**Action Button:**
- **Submit Question**: To submit your answer once the calculation is complete.
This setup allows users to visually understand the concept of normal distribution and probability calculations by adjusting values on the graph.](/v2/_next/image?url=https%3A%2F%2Fcontent.bartleby.com%2Fqna-images%2Fquestion%2F0ca25b1c-6af6-4ee0-9ddb-d1a9acbee9fc%2Fe89cd5ce-7f77-46b2-ab0e-db29668460dd%2Fgmqbtpr_processed.jpeg&w=3840&q=75)
Transcribed Image Text:**Problem Statement:**
Assume that the readings at freezing on a batch of thermometers are normally distributed with a mean of 0°C and a standard deviation of 1.00°C. A single thermometer is randomly selected and tested. Find the probability of obtaining a reading less than -0.24°C.
**Interactive Element:**
- **Shade Option:** Left of a value
- **Instruction:** Click and drag the arrows to adjust the values.
**Graph Description:**
The graph shown is a normal distribution curve representing the standard normal distribution with a mean of 0.
- The x-axis ranges from -4 to 4.
- A blue shaded area under the curve extends to the left of -0.24°C.
- The shading highlights the probability of obtaining a reading less than the selected value.
- An arrow is pointing to -0.24 on the x-axis, indicating the critical value for this probability calculation.
**Mathematical Equation:**
\[ P(x < -0.24°C) = P(z < -0.24) = \text{(probability value to be calculated)} \]
**Action Button:**
- **Submit Question**: To submit your answer once the calculation is complete.
This setup allows users to visually understand the concept of normal distribution and probability calculations by adjusting values on the graph.
Expert Solution
Step 1
Draw the graph:

Step by step
Solved in 2 steps with 3 images

Knowledge Booster


Learn more about
Need a deep-dive on the concept behind this application? Look no further. Learn more about this topic, statistics and related others by exploring similar questions and additional content below.Recommended textbooks for you
MATLAB: An Introduction with Applications
Statistics
ISBN:
9781119256830
Author:
Amos Gilat
Publisher:
John Wiley & Sons Inc

Probability and Statistics for Engineering and th…
Statistics
ISBN:
9781305251809
Author:
Jay L. Devore
Publisher:
Cengage Learning

Statistics for The Behavioral Sciences (MindTap C…
Statistics
ISBN:
9781305504912
Author:
Frederick J Gravetter, Larry B. Wallnau
Publisher:
Cengage Learning
MATLAB: An Introduction with Applications
Statistics
ISBN:
9781119256830
Author:
Amos Gilat
Publisher:
John Wiley & Sons Inc
Probability and Statistics for Engineering and th…
Statistics
ISBN:
9781305251809
Author:
Jay L. Devore
Publisher:
Cengage Learning
Statistics for The Behavioral Sciences (MindTap C…
Statistics
ISBN:
9781305504912
Author:
Frederick J Gravetter, Larry B. Wallnau
Publisher:
Cengage Learning

Elementary Statistics: Picturing the World (7th E…
Statistics
ISBN:
9780134683416
Author:
Ron Larson, Betsy Farber
Publisher:
PEARSON

The Basic Practice of Statistics
Statistics
ISBN:
9781319042578
Author:
David S. Moore, William I. Notz, Michael A. Fligner
Publisher:
W. H. Freeman

Introduction to the Practice of Statistics
Statistics
ISBN:
9781319013387
Author:
David S. Moore, George P. McCabe, Bruce A. Craig
Publisher:
W. H. Freeman