Applying the Concepts and SkillsIn Exercises, use the technology of your choice toa. conduct a Kruskal–Wallis test on the data at the specified significance level.b. interpret your results from part (a). Note: All data sets are on the WeissStats site.Ground Water. The data from Exercise on the concentrations, in milligrams per liter, of each of four chemicals among three different wells. Use a 1% significance level.In Exercises, use the technology of your choice toa. conduct a one-way ANOVA test on the data.b. interpret your results from part (a).c. decide whether presuming that the assumptions of normal populations and equal population standard deviations are met is reasonable.Ground Water. The U.S. Geological Survey, in cooperation with the Florida Department of Environmental Protection, investigated the effects of waste disposal practices on ground water quality at five poultry farms in north-central Florida. At one site, they drilled four monitoring wells, numbered 1, 2, 3, and 4. Over a period of 9 months, water samples were collected from the last three wells and analyzed for a variety of chemicals, including potassium, chlorides, nitrates, and phosphorus. The concentrations, in milligrams per liter, are provided on the WeissStats site. For each of the four chemicals, decide whether the data provide sufficient evidence to conclude that a difference exists in mean concentration among the three wells. Use a = 0.01. [SOURCE: USGS Water Resources Investigations Report 95-4064, Effects of Waste-Disposal Practices on Ground- Water Quality at Five Poultry (Broiler) Farms in North-Central Florida, H. Hatzell, U.S. Geological Survey]
Applying the Concepts and Skills
In Exercises, use the technology of your choice to
a. conduct a Kruskal–Wallis test on the data at the specified significance level.
b. interpret your results from part (a). Note: All data sets are on the WeissStats site.
Ground Water. The data from Exercise on the concentrations, in milligrams per liter, of each of four chemicals among three different wells. Use a 1% significance level.
In Exercises, use the technology of your choice to
a. conduct a one-way ANOVA test on the data.
b. interpret your results from part (a).
c. decide whether presuming that the assumptions of normal populations and equal population standard deviations are met is reasonable.
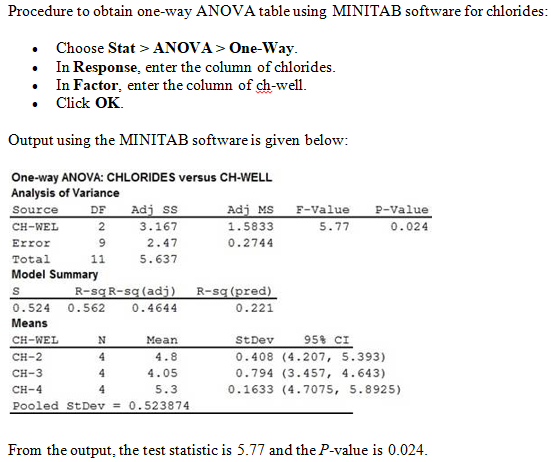
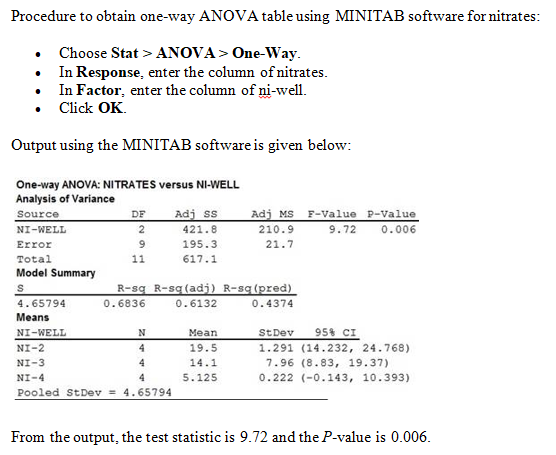
Ground Water. The U.S. Geological Survey, in cooperation with the Florida Department of Environmental Protection, investigated the effects of waste disposal practices on ground water quality at five poultry farms in north-central Florida. At one site, they drilled four monitoring wells, numbered 1, 2, 3, and 4. Over a period of 9 months, water samples were collected from the last three wells and analyzed for a variety of chemicals, including potassium, chlorides, nitrates, and phosphorus. The concentrations, in milligrams per liter, are provided on the WeissStats site. For each of the four chemicals, decide whether the data provide sufficient evidence to conclude that a difference exists in mean concentration among the three wells. Use a = 0.01. [SOURCE: USGS Water Resources Investigations Report 95-4064, Effects of Waste-Disposal Practices on Ground- Water Quality at Five Poultry (Broiler) Farms in North-Central Florida, H. Hatzell, U.S. Geological Survey]
a)
The information is the investigator wants to find the effects of waste disposal practices on ground water quality. They monitored 9 months and analyzed the variety of chemicals includes the potassium, chlorides, nitrates and phosphorous.
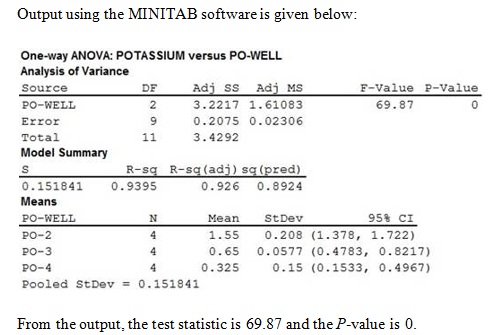
Procedure to obtain one-way ANOVA table using MINITAB software for potassium:
- Choose Stat > ANOVA > One-Way.
- In Response, enter the column of potassium.
- In Factor, enter the column of po-well.
- Click OK.


Step by step
Solved in 7 steps with 8 images


