Answer d,e,f and g Many elderly people in the US receive Social Security payments as their sole source of income. Because of this, there have been attempts to adjust these payments so as to keep up with changing prices (inflation). This process is called “indexing”; this question will lead you through the process. Suppose that in the year 2018, a typical Social Security recipient consumed only Food (F) and Housing (H). The price of housing was $150/unit and the price of food was $50/unit. Denote the quantities of food and housing per month by F and H respectively. This consumer received $1500/month and consumed 5 units of housing and 15 units of food. (a) Write out the consumer’s budget constraint and demonstrate that the bundle chosen falls on that budget constraint. (b) Draw the budget constraint on a graph (Housing on the horizontal axis) with the optimal bundle labeled. Draw the indifference curve through that optimal bundle. Assume preferences are well behaved. Suppose that in 2019, the price of food increased to $100 and the price of housing increased to $200. (c) What is the cost of the consumer’s original 2018 bundle at the new 2019 prices? How much additional income would this consumer need in order to afford the original bundle? (d) Using your answer to (c), calculate the rate of inflation using the con- sumer price index based on the 2018 bundle (more generally called a Laspeyres price index). (e) Suppose the consumer’s income is increased by the rate you found in (d), which also corresponds to the amount of income you found in (c). On a graph measuring the quantity of housing on the horizontal axis and quantity of food on the vertical axis, depict the original budget constraint and the new budget constraint after income is compensated according to (c). Include the indifference curve at the point (5,15). Label this new budget constraint BCC , where C is 2019 for “compensated”. (f) What is the slope of the 2018 budget constraint? What is the slope of the 2019 budget constraint BCC ? Lastly, at the bundle (5,15), 2019 what is the slope of the indifference curve (i.e., the MRS)?
Answer d,e,f and g
Many elderly people in the US receive Social Security payments as their sole source of income. Because of this, there have been attempts to adjust these payments so as to keep up with changing prices (inflation). This process is called “indexing”; this question will lead you through the process. Suppose that in the year 2018, a typical Social Security recipient consumed only Food (F) and Housing (H). The
(a) Write out the consumer’s budget constraint and demonstrate that the bundle chosen falls on that budget constraint.
(b) Draw the budget constraint on a graph (Housing on the horizontal axis) with the optimal bundle labeled. Draw the indifference curve through that optimal bundle. Assume preferences are well behaved.
Suppose that in 2019, the price of food increased to $100 and the price of housing increased to $200.
(c) What is the cost of the consumer’s original 2018 bundle at the new 2019 prices? How much additional income would this consumer need in order to afford the original bundle?
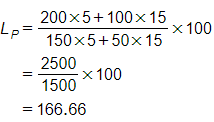
(d) Using your answer to (c), calculate the rate of inflation using the con- sumer price index based on the 2018 bundle (more generally called a Laspeyres price index).
(e) Suppose the consumer’s income is increased by the rate you found in (d), which also corresponds to the amount of income you found in (c). On a graph measuring the quantity of housing on the horizontal axis and quantity of food on the vertical axis, depict the original budget constraint and the new budget constraint after income is compensated according to (c). Include the indifference curve at the point (5,15). Label this new budget constraint BCC , where C is 2019 for “compensated”.
(f) What is the slope of the 2018 budget constraint? What is the slope of the 2019 budget constraint BCC ? Lastly, at the bundle (5,15), 2019 what is the slope of the indifference curve (i.e., the MRS)?
(g) The Laspeyres Price Index, as we have been describing above, mea- sures inflation by looking at how the cost of a particular bundle of goods a consumer purchases in a previous year changes. Critics claim that this measure of inflation overstates changes in the cost of living for the reason outlined in the problems above. Can you explain why?
Answer d,e,f and g
Since we only answer up to 3 sub-parts, we’ll answer the first 3. Please resubmit the question and specify the other subparts (up to 3) you’d like answered
Answer:
Given,
Two goods:
Housing (H), and Food (F)
Prices:
Price of housing = $150
Price of food = $50
Total income = $1500
Optimal bundle = (5 (H), 15 (F))
Calculation:
(d).
The formula of the Laspeyres price index:

Laspeyres price index in 2018:
In the 2018 (base year) price of the current and base year, both will be the same because the base year is also the current year.
Laspeyres price index in 2019:

Inflation= 166.66 - 100= 66.66%
Step by step
Solved in 2 steps with 3 images


