Answer a-c  Intervention   Control          (16.70)         12.00         (14.80)         10.00         (11.90)           9.00           (9.70)           8.60           (9.60)           7.10           (8.80)           6.70           (8.00)           6.10           (7.10)           4.80           (6.60)           4.60           (6.00)           4.50           (5.60)           2.80           (5.60)           2.80           (5.50)           2.80           (5.50)           2.70           (5.10)           1.80           (5.00)           1.60           (5.00)           1.00           (4.80)           0.70           (4.40)           0.40           (4.40)           0.10           (4.10)           0.10           (4.00)         (5.10)           (4.00)         (5.10)           (3.60)             (3.50)           (3.20)           (2.80)           (2.00)           (1.80)           (1.80)           (1.40)           (1.20)           (0.20)           (0.10)                -               0.20             0.60             1.00             1.20             1.20             1.40             1.80             2.00             2.20             2.50             2.80             3.30             4.20             5.40             5.80             6.00             6.40             8.40

MATLAB: An Introduction with Applications
6th Edition
ISBN:9781119256830
Author:Amos Gilat
Publisher:Amos Gilat
Chapter1: Starting With Matlab
Section: Chapter Questions
Problem 1P
icon
Related questions
icon
Concept explainers
Question

Answer a-c

 Intervention   Control 
        (16.70)         12.00
        (14.80)         10.00
        (11.90)           9.00
          (9.70)           8.60
          (9.60)           7.10
          (8.80)           6.70
          (8.00)           6.10
          (7.10)           4.80
          (6.60)           4.60
          (6.00)           4.50
          (5.60)           2.80
          (5.60)           2.80
          (5.50)           2.80
          (5.50)           2.70
          (5.10)           1.80
          (5.00)           1.60
          (5.00)           1.00
          (4.80)           0.70
          (4.40)           0.40
          (4.40)           0.10
          (4.10)           0.10
          (4.00)         (5.10)
          (4.00)         (5.10)
          (3.60)  
          (3.50)  
        (3.20)  
        (2.80)  
        (2.00)  
        (1.80)  
        (1.80)  
        (1.40)  
        (1.20)  
        (0.20)  
        (0.10)  
             -    
          0.20  
          0.60  
          1.00  
          1.20  
          1.20  
          1.40  
          1.80  
          2.00  
          2.20  
          2.50  
          2.80  
          3.30  
          4.20  
          5.40  
          5.80  
          6.00  
          6.40  
          8.40  
Food counseling for obese children. According to the Centers for Disease Control and
Prevention, obesity rates among children have increased dramatically over the past three
decades, from a low of about 5% to 18% as of 2010. A study examined the effect of family-based
food-counseling sessions provided by trained professionals. The study randomly assigned obese
children aged 9 to 12 years to either the counseling intervention or a control group not receiving
any food counseling. The children's weight changes (in pounds, Ib) after 15 weeks are displayed
in Table on the right for both conditions.
a)
Plot each data set in Histogram to investigate the shape of the distributions and explain the
what you see. (Hint: Don't be afraid to look at diffent Bin ranges)
Explanation
b)
Set up the Null and Alternative Hypothesis (95% Confidence)
Null Hypothesis
Alternative Hypothesis
c)
What are the df (degrees of Freedom)?
d)
What is the p-value (Show you work on how you got it).
e)
Determine the Confidence Interval ay 95%.
f)
Is there good evidence that obese children receiving food counseling gain less weight over a
15-week period?
Explanation
Transcribed Image Text:Food counseling for obese children. According to the Centers for Disease Control and Prevention, obesity rates among children have increased dramatically over the past three decades, from a low of about 5% to 18% as of 2010. A study examined the effect of family-based food-counseling sessions provided by trained professionals. The study randomly assigned obese children aged 9 to 12 years to either the counseling intervention or a control group not receiving any food counseling. The children's weight changes (in pounds, Ib) after 15 weeks are displayed in Table on the right for both conditions. a) Plot each data set in Histogram to investigate the shape of the distributions and explain the what you see. (Hint: Don't be afraid to look at diffent Bin ranges) Explanation b) Set up the Null and Alternative Hypothesis (95% Confidence) Null Hypothesis Alternative Hypothesis c) What are the df (degrees of Freedom)? d) What is the p-value (Show you work on how you got it). e) Determine the Confidence Interval ay 95%. f) Is there good evidence that obese children receiving food counseling gain less weight over a 15-week period? Explanation
Expert Solution
Step 1

Hello! As you have posted more than 3 sub parts, we are answering the first 3 sub-parts.  In case you require the unanswered parts also, kindly re-post that parts separately.

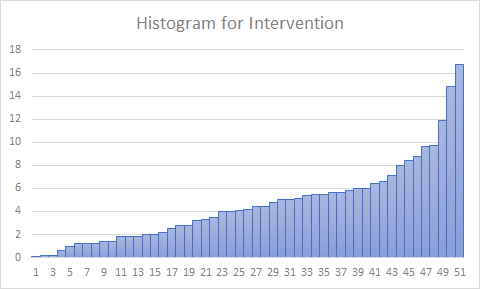
Excel Procedure:

  • Enter the intervention in Excel.
  • Select the data in excel.
  • Go to insert.
  • Go to insert statistic chart.
  • click on histogram.

Excel Output:

 Statistics homework question answer, step 1, image 1

From the histogram, the intervention values are distributed to left skewed.


Step 2

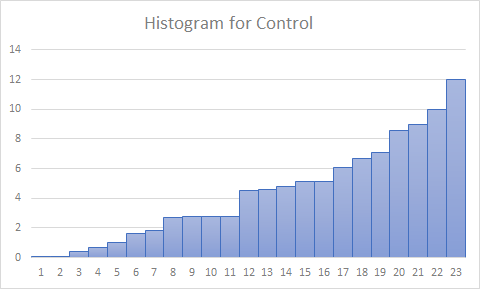
Excel Procedure:

  • Enter the control in Excel.
  • Select the data in excel.
  • Go to insert.
  • Go to insert statistic chart.
  • click on histogram.

Excel Output:

Statistics homework question answer, step 2, image 1

From the histogram, the control values are distributed to left skewed.


steps

Step by step

Solved in 3 steps with 2 images

Blurred answer
Knowledge Booster
Correlation, Regression, and Association
Learn more about
Need a deep-dive on the concept behind this application? Look no further. Learn more about this topic, statistics and related others by exploring similar questions and additional content below.
Similar questions
Recommended textbooks for you
MATLAB: An Introduction with Applications
Statistics
ISBN:
9781119256830
Author:
Amos Gilat
Publisher:
John Wiley & Sons Inc
Probability and Statistics for Engineering and th…
Statistics
ISBN:
9781305251809
Author:
Jay L. Devore
Publisher:
Cengage Learning
Statistics for The Behavioral Sciences (MindTap C…
Statistics
ISBN:
9781305504912
Author:
Frederick J Gravetter, Larry B. Wallnau
Publisher:
Cengage Learning
Elementary Statistics: Picturing the World (7th E…
Statistics
ISBN:
9780134683416
Author:
Ron Larson, Betsy Farber
Publisher:
PEARSON
The Basic Practice of Statistics
Statistics
ISBN:
9781319042578
Author:
David S. Moore, William I. Notz, Michael A. Fligner
Publisher:
W. H. Freeman
Introduction to the Practice of Statistics
Statistics
ISBN:
9781319013387
Author:
David S. Moore, George P. McCabe, Bruce A. Craig
Publisher:
W. H. Freeman