An experiment was conducted to test whether classical music helps with mathematical performance. To study this, participants (n=9) were given an algebra test. Half of the sample completed the test in a room with classical music playing while the other half completed it in a room with no sounds at all. After a brief rest, the two groups switched rooms and completed a slightly modified version of the algebra test. Thus, all participants experienced both conditions. The scores for the two conditions were then compared, showing that listening to classical music did help mathematical performance by an average of MD =2 points with SS =32. a. Using symbols, state the hypotheses for a two-tailed test with α=0.01. b. Identify the degrees of freedom and the critical regions. c. Calculate the sample variance. d. Calculate the estimated standard error. e. Compute the t statistic and state the conclusion of these findings.


Inverse Normal Distribution
The method used for finding the corresponding z-critical value in a normal distribution using the known probability is said to be an inverse normal distribution. The inverse normal distribution is a continuous probability distribution with a family of two parameters.
Mean, Median, Mode
It is a descriptive summary of a data set. It can be defined by using some of the measures. The central tendencies do not provide information regarding individual data from the dataset. However, they give a summary of the data set. The central tendency or measure of central tendency is a central or typical value for a probability distribution.
Z-Scores
A z-score is a unit of measurement used in statistics to describe the position of a raw score in terms of its distance from the mean, measured with reference to standard deviation from the mean. Z-scores are useful in statistics because they allow comparison between two scores that belong to different normal distributions.
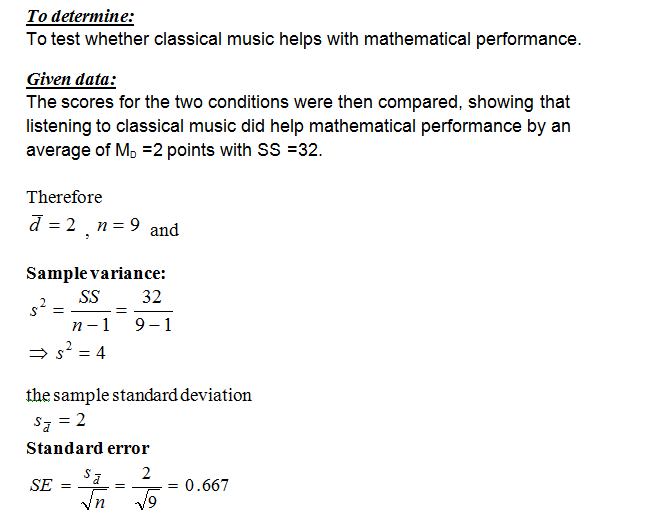
An experiment was conducted to test whether classical music helps with mathematical performance. To study this, participants (n=9) were given an algebra test. Half of the sample completed the test in a room with classical music playing while the other half completed it in a room with no sounds at all. After a brief rest, the two groups switched rooms and completed a slightly modified version of the algebra test. Thus, all participants experienced both conditions. The scores for the two conditions were then compared, showing that listening to classical music did help mathematical performance by an average of MD =2 points with SS =32.
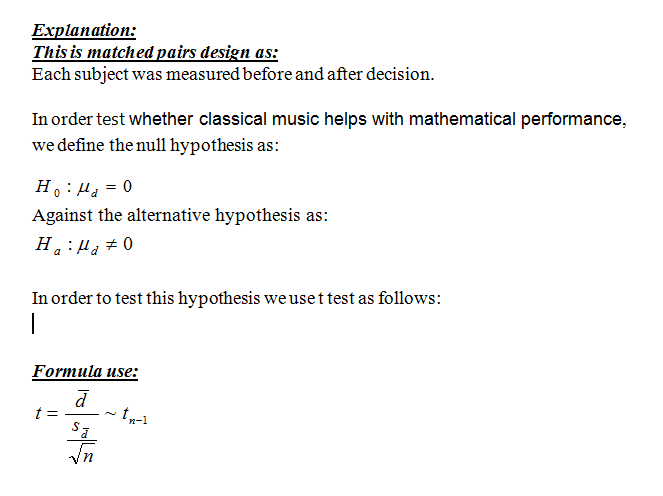
a. Using symbols, state the hypotheses for a two-tailed test with α=0.01.
b. Identify the degrees of freedom and the critical regions.
c. Calculate the sample variance.
d. Calculate the estimated standard error.
e. Compute the t statistic and state the conclusion of these findings.

Step by step
Solved in 4 steps with 4 images


