An economist wonders if corporate productivity in some countries is more volatile than in other countries. One measure of a company's productivity is annual percentage yield based on total company assets. A random sample of leading companies in France gave the following percentage yields based on assets. 4.3 5.1 3.8 3.6 2.2 3.5 2.8 4.4 5.7 3.4 4.1 6.8 2.9 3.2 7.2 6.5 5.0 3.3 2.8 2.5 4.5 Use a calculator to verify that the sample variance is s2 ≈ 2.042 for this sample of French companies. Another random sample of leading companies in Germany gave the following percentage yields based on assets. 3.3 3.9 3.7 4.6 5.1 5.5 5.0 5.4 3.2 3.5 3.7 2.6 2.8 3.0 3.0 2.2 4.7 3.2 Use a calculator to verify that s2 ≈ 1.024 for this sample of German companies. Test the claim that there is a difference (either way) in the population variance of percentage yields for leading companies in France and Germany. Use a 5% level of significance. How could your test conclusion relate to the economist's question regarding volatility (data spread) of corporate productivity of large companies in France compared with companies in Germany? (a) What is the level of significance? (b) Find the value of the sample F statistic. (Use 2 decimal places.) What are the degrees of freedom? dfN dfD


Inverse Normal Distribution
The method used for finding the corresponding z-critical value in a normal distribution using the known probability is said to be an inverse normal distribution. The inverse normal distribution is a continuous probability distribution with a family of two parameters.
Mean, Median, Mode
It is a descriptive summary of a data set. It can be defined by using some of the measures. The central tendencies do not provide information regarding individual data from the dataset. However, they give a summary of the data set. The central tendency or measure of central tendency is a central or typical value for a probability distribution.
Z-Scores
A z-score is a unit of measurement used in statistics to describe the position of a raw score in terms of its distance from the mean, measured with reference to standard deviation from the mean. Z-scores are useful in statistics because they allow comparison between two scores that belong to different normal distributions.
An economist wonders if corporate productivity in some countries is more volatile than in other countries. One measure of a company's productivity is annual percentage yield based on total company assets.
A random sample of leading companies in France gave the following percentage yields based on assets.
| 4.3 | 5.1 | 3.8 | 3.6 | 2.2 | 3.5 | 2.8 | 4.4 | 5.7 | 3.4 | 4.1 |
| 6.8 | 2.9 | 3.2 | 7.2 | 6.5 | 5.0 | 3.3 | 2.8 | 2.5 | 4.5 |
Use a calculator to verify that the sample variance is s2 ≈ 2.042 for this sample of French companies.
Another random sample of leading companies in Germany gave the following percentage yields based on assets.
| 3.3 | 3.9 | 3.7 | 4.6 | 5.1 | 5.5 | 5.0 | 5.4 | 3.2 |
| 3.5 | 3.7 | 2.6 | 2.8 | 3.0 | 3.0 | 2.2 | 4.7 | 3.2 |
Use a calculator to verify that s2 ≈ 1.024 for this sample of German companies.
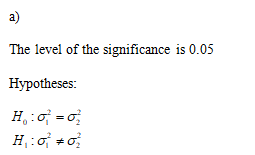
Test the claim that there is a difference (either way) in the population variance of percentage yields for leading companies in France and Germany. Use a 5% level of significance. How could your test conclusion relate to the economist's question regarding volatility (data spread) of corporate productivity of large companies in France compared with companies in Germany?
What are the degrees of freedom?
| dfN | |
| dfD |
The sample mean for first sample:
By using EXCEL,
- Enter the data.
- Enter the formula of AVERAGE(A1:A21)
- the answer is 4.17
The sample variance for first sample
- Enter the data.
- Enter the formula of VAR(A1:A21)
- the answer is 2.042
The sample mean for second sample
- Enter the data.
- Enter the formula of AVERAGE(B1:B18)
- the answer is 3.8
The sample variance for SECOND sample
- Enter the data.
- Enter the formula of VAR(B1:B18)
- the answer is 1.024

Trending now
This is a popular solution!

Step by step
Solved in 3 steps with 2 images


