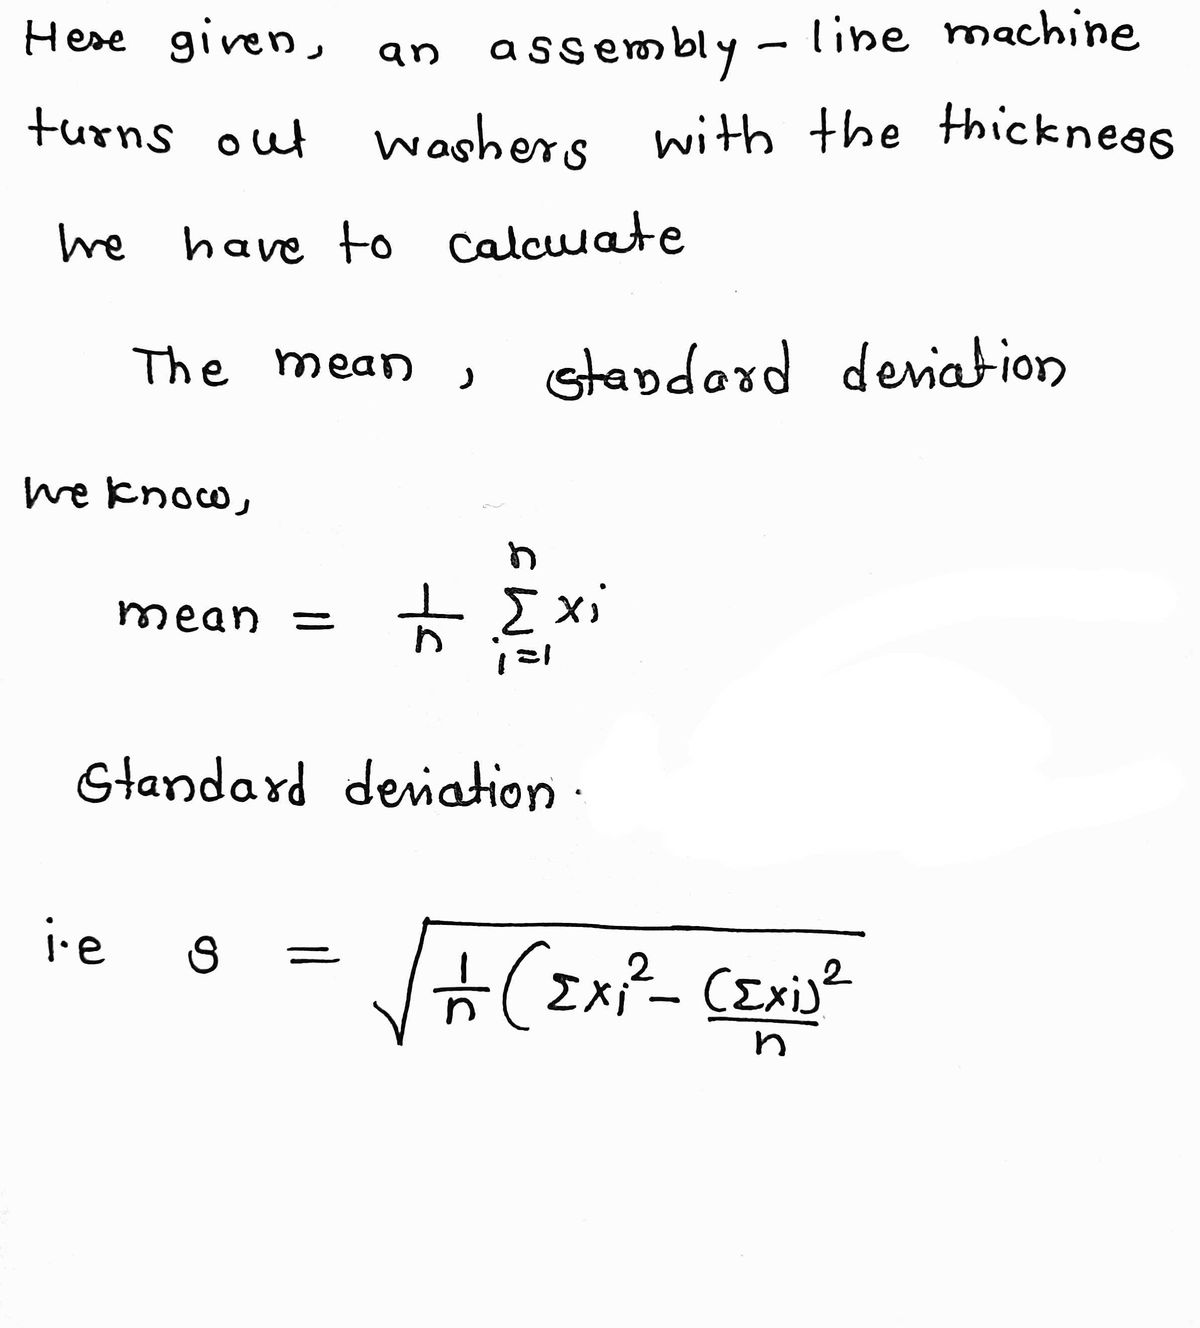
An assembly-line machine turns out washers with the following thicknesses (in millimeters). Find the mean and standard deviation of the thicknesses. 1.64 1.77 1.88 1.64 1.91 1.34 1.75 1,91 1.37 1.34 1.52 2.09 1.43 2.03 1.72 2.05 The mean is mm. (Round to four decimal places as needed.)
Q: Type of background music during the test Rock Mean N Std. Deviation Mean N Std. Deviation Mean N…
A: In the given case,The one-way analysis of variance (ANOVA) is utilized to figure out if there are…
Q: The average temperature in Anchorage, Alaska, in January is 21'F with a standard deviation of 10°.…
A: For Anchorage, μ=21σ=10 Consider, the probability that the temperature in a January with a high of…
Q: An assembly-line machine turns out washers with the following thicknesses (in millimeters). Find the…
A:
Q: Illustration 77 A normal distribution is known to have the following parameters: Mean = 25, S.D. =…
A:
Q: Use the body temperatures, in degrees Fahrenheit, listed in the accompanying table. The range of the…
A:
Q: The average birth weight of domestic cats is about 3 ounces. Assume that the distribution of birth…
A: a. Let x be the birth weight of cats which follows normal distribution with mean 3 ounces and…
Q: need really fast please
A: Given that The data are 22 , 30 , 41 , 53 , 28 , 29 , 32 , 31 , 44 , 53 , 21 , 31 , 40 , 55 , 26 ,…
Q: B. Answer the following: 1. Area under the normal curve Find the area under the normal curve: Refer…
A: a) Here,P0<Z<2.5=PZ<2.5-PZ<0=0.9938-0.5=0.4938 Therefore, the area under the normal…
Q: Complete the table by solving for the deviation below Mass Measured value Deviation…
A: Given data: Mass Measured value 1 8.21 cm 2 8.24 cm 3 8.22 cm 4 8.23 cm 5 8.24 cm 6…
Q: Calculate the sample standard deviation for this data set: 65, 48, 70. The formula for the sample…
A:
Q: c. The probability that the round off error for a jumper's distance is exactly 1.2 is P(x = 1.2) =…
A: Since you have posted a question with multiple sub-parts, we will solve the first three subparts for…
Q: ount of time an individual spends completing tax forms is 7.9 hours. Data: x¯=8.3 hr,s=2.1 hr,
A: As the population standard deviation is not known, we will use t distribution.
Q: A vertical line drawn through a normal distribution at z = -0.60 separates the distribution into two…
A: A standard normal variable z follows normal distribution with mean 0 and standard deviation 1.
Q: Find the standard deviation of the percent change in market share for the control cities. Percent…
A: Solution..
Q: The angle of friction of a soil has a mean value of 35° and a standard deviation of 5°. Determine…
A:
Q: The number of milliseconds required for a light beam to go from A to B is given below. Find the…
A:
Q: 5. Losses X follow a paralogistic distribution with 0 =5000 and a = 3. An insurance coverage for X…
A: Given : θ = 5000α = 3
Q: A variable is normally distributed with mean 20 and standard deviation 7. Use your graphing…
A: The given mean is 20 and standard deviation is 7.
Q: Given that it is normally distributed with a standard deviation of 8.025 cm. State the mode of the…
A:
Q: The MARV value of the grab tensile strength is 1200 N for a geotextile. The standard deviation of…
A: From the given information, the MARV value of the grab tensile strength is 1200 N for a geotextile.…
Q: The histogram below shows the magnitude of 500 earthquakes occurring near a location in Southern…
A: The histogram helps in understanding the distribution of the data.
Q: Solve the following problems completely. Box and round your final answer up to 4 decimal places,…
A: We have given that, Let X denotes the thickness of a flange with uniformly distributed with a=0.95…
Q: help with letter e please Given a normal distribution with μ = 35 and σ = 8, find a.the normal curve…
A:
Q: 1. 2. Calculate the mean and standard deviation of the readings. Construct a control chart. Use the…
A: The given data values are arranged in the following table 7 hrs7 hrs 45 mins8 hrs 15 mins9hrs6 hrs…
Q: The following readings were recorded for voltage measurement : 8.3, 7.8, 8.6, 7.2, 8.3, 7.9,…
A: As per our guidelines we are supposed to answer only 3 subparts of any questions so i am solving…
Q: Find the area of the shaded region. The graph to the right depicts IQ scores of adults, and those…
A: Step 1:Given that :mean(μ)=100Standard deviation(σ)=15Let X is the IQ score of adults .We want the…
Q: Which of the following is the statistical symbol for population standard deviation?
A: The standard deviation tells us about the spread of the data points from the mean value. The…
Q: I need help with number 5. Please explain.
A:
Q: Find the z-score for the value 86, when the mean is 61 and the standard deviation is 1. O A. z= -…
A:
Q: Below is a stem-plot of the birth weights of male babies born to the smoking group. The stems are in…
A: Obtain the median birth weight. The median birth weight is obtained below as follows: The…
Q: The length (in pages) of math research projects is given below. Using this information, calculate…
A: The length of math research projects is given. There are 9 data observations given. Thus, n= 9.
Q: Calculate Mean Deviation (from arithmetic average) for the following values. Also calculate its…
A: Data given 4800,4600,4400,4200,4000
Q: Explain what the following terms / tests are used to calculate. Write the formula that calculates…
A: STANDARD DEVIATION: The standard deviation is a term that belongs to descriptive measure of…
Q: Below are the ages of every resident of a very small assisted living facility. Find the standard…
A:
Q: A variable is normally distributed with mean 21 and standard deviation 3. Use your graphing…
A: Since we only answer up to 3 sub-parts, we’ll answer the first 3. Please resubmit the question and…
Q: Calculate the standard error. May normality be assumed? (Round your answers to 4 decimal places.)…
A: The objective is to find the standard error using the given information.
Q: 6 Six wind turbines are to be erected in a straight line across the fields of a farm. The wind…
A: Since you have asked multiple questions, we will solve the first question for you. If you want any…
Trending now
This is a popular solution!
Step by step
Solved in 2 steps with 2 images
- Please choice the correct answerFind the explained variation, unexplained variation, total variation, coefficient of determination, and standard error of estimate. Round to a minimum of 4 decimal places, if necessary.Eight different second-year medical students took blood pressure measurements of the same patient and the results are listed below. Systolic 131 130 120 139 145 129 146 121 Diastolic 88 96 81 99 98 86 98 79 Explained variation ? Unexplained variation ? Total variation ?please explain how to find proportions and how I know which side the tail lands on.
- A sample of human brain volumes (cm³) is given below. Use the given data values to identify the corresponding z scores that are used for a normal quantile plot, then identify the coordinates of each point in the normal quantile plot. Construct the normal quantile plot, then determine whether the data appear to be from a population with a normal distribution. 1075 O A. List the z scores for the normal quantile plot. 10 (Round to two decimal places as needed. Use ascending order.) O C. z score z score 321 Identify the coordinates of each point in the normal quantile plot. Use ordered pairs of the form (x,y), where x is the sorted human brain volumes, and y is the corresponding z score. ☐☐☐☐☐☐☐☐ (Type ordered pairs. Round to two decimal places as needed. Use ascending order.) Construct the normal quantile plot. -2- -3- 900 1077 WARU 957 -2- -3+ 900 1026 X Values X Values 1077 1500 1500 Q Q OB. O D. 1443 z score z score Do the data appear to come from a normally distributed population? ܚ ܝ…Fill in the following values in the table using the rounded mean you got in the question above.Round each answer to 6 decimal places. First Six Presidents Age (X-X¯)^2 George Washington 57 John Adams 61 Thomas Jefferson 57 James Madison 57 James Monroe 58 John Quincy Adams 57 SUM What is the standard deviation of the First Six Presidents? Round your answer to 3 decimal places as neededStandard Deviation =The length of a metal block is measured 4 times using a ruler. The results are shown below: measurement # length l (mm) 1 23.5 2 23.8 3 23.2 4 23.6 First, calculate the mean length and fill it in the blank below. Next, fill in the blanks for the differences and in the table above. Finally, calculate the standard deviation, the standard deviation of the mean and the 2σ uncertainty and fill in the blanks below. Important notes (read before entering your answers): Enter the values in mm using decimal notation (e.g. 0.0123). A leading zero before the decimal point must be entered (e.g. 0.0123, not .0123). Do not use scientific notation, as it will not be recognized, and do not enter the units. Do not round the numbers, as this may cause rounding errors to accumulate. Mean length: mm Standard deviation mm Standard deviation of the mean mm 2σ uncertainty mm
- The blood pressure in millimeters was measured for a large sample of people. The average pressure is 140 mm, and the SD of the measurements is 20 mm. The histogram looks reasonably like a normal curv Use the normal curve to estimate the following percentages. Choose the answer that is closest to being correct. A 19.1% B 30.9% C 38.2% D 69.1% E 68.27% A The percentage of people with blood pressure between 130 and 150 mm. B The percentage of people with blood pressure between 140 and 150 mm. D The percentage of people with blood pressure over 150 mm.suppose that peices of a gallon of mill at various stores in one town have amean of $3.75 with a stabdard deviation of $0.09 use chebyshev theourm what is the minimum percentage of stires that sell a gallon of milk for between $3.57 and $3.93 round your answer tk ine decimal placeFind the indicated IQ score. The graph to the right depicts IQ scores of adults, and those scores are normally distributed with a mean of 100 and a standard deviation of 15. The indicated IQ score is (Round to the nearest whole number as needed.) si 0.2525 Q
- What is the population standard deviation using the following formulaThe table shows the scores of 20 people who took a paramedics licensing test. Find the mean and standard deviation for these data. The mean of the data is The standard deviation is approximately Round to three decimal places as needed.) Score Frequency 7 1 3 6 2 1 (.... NKR888 74 75 79 86 98 0Estimate the distance traveled in 20 seconds given the following sample velocities using right- endpoint values. Be sure to write the units for your answer. Time (s) 10 15 20 Velocity (m/s) 3 3.4 2.9 2.4 1