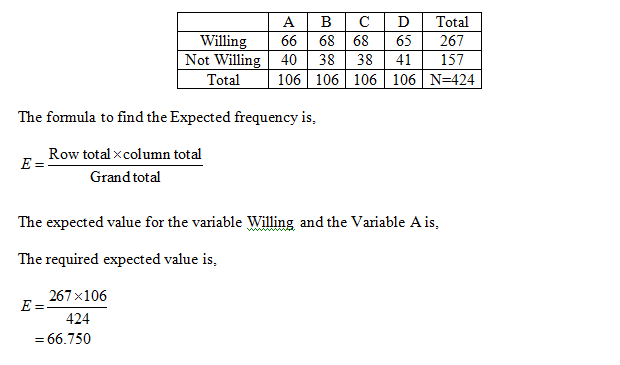
An advertising firm has decided to ask 106 customers at each of four local shopping malls if they are willing to take part in a market research survey. At a = 0.01 is there evidence to show that the proportions are not all the same. A В C D Willing 66 68 68 65 Not Willing 40 38 38 41 What are the expected numbers? (round to 3 decimal places) A В C D Willing Not Willing The hypotheses are Но: РА — рв — Рс — pD HA: At least one of the proportions is different. (claim) Since a = 0.01 the critical value is 11.345 The test value is: (round to 3 decimal places) The p-value is (round to 3 decimal places) So the decision is to O reject Ho O do not reject Ho Thus the final conclusion is O There is enough evidence to support the claim that at least one of the proportions is different. O There is enough evidence to reject the claim that at least one of the proportions is different. O There is not enough evidence to reject the claim that at least one of the proportions is different. O There is not enough evidence to support the claim that at least one of the proportions is different.
Contingency Table
A contingency table can be defined as the visual representation of the relationship between two or more categorical variables that can be evaluated and registered. It is a categorical version of the scatterplot, which is used to investigate the linear relationship between two variables. A contingency table is indeed a type of frequency distribution table that displays two variables at the same time.
Binomial Distribution
Binomial is an algebraic expression of the sum or the difference of two terms. Before knowing about binomial distribution, we must know about the binomial theorem.
47

State the hypotheses.

That is, there is no evidence to conclude that the proportions are not all the same.

There is evidence to conclude that the proportions are not all the same.
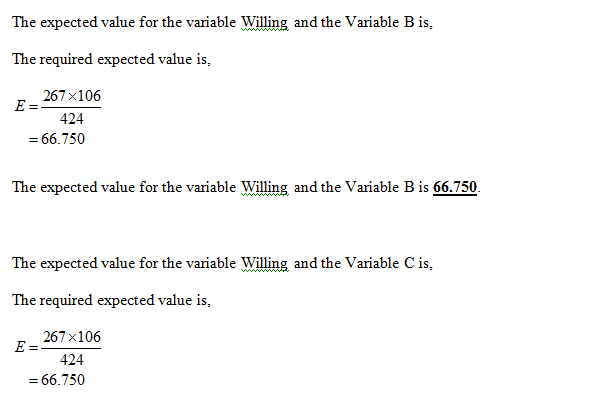
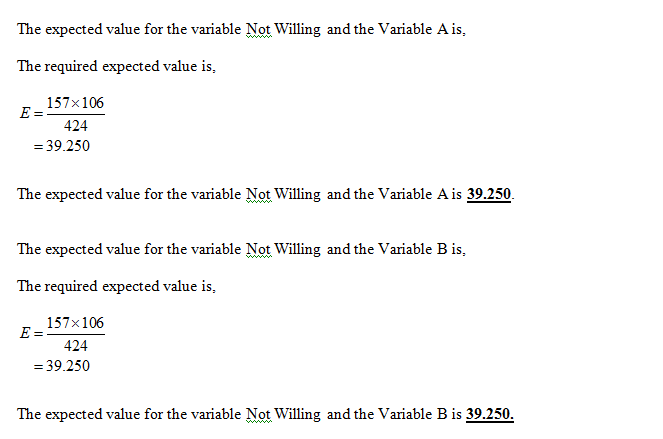
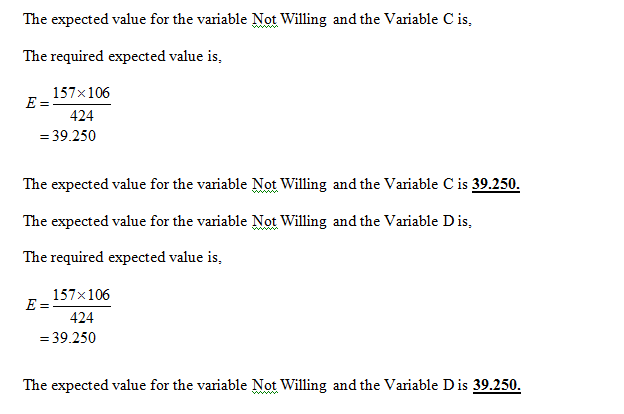
Obtain the value of the expected numbers.
The value of the expected numbers is obtained below as follows:
From the information, given that

The expected value for the variable Willing and the Variable A is 66.750.

The expected value for the variable Willing and the Variable C is 66.750


Step by step
Solved in 3 steps with 11 images


