### Understanding Piecewise Functions from Graphs #### Graph Description The graph shown represents a piecewise function \( g \) with two distinct intervals. It consists of two separate curve segments with their endpoints: 1. **First Segment**: - Starts with an open circle at \( (-3, -1) \). - The curve increases to a closed circle at \( (0, 4) \). 2. **Second Segment**: - Begins with a point, continuing from \( (1, 2.5) \). - The curve decreases to a closed circle at \( (5, -3) \). #### Domain and Range - **Domain**: The values of \( x \) for which the function is defined. In this case, the domain can be expressed as a union of intervals: \( (-3, 0] \cup [1, 5] \). - **Range**: The values of \( y \) that the function can take. Based on the graph, the range is \( [-1, 4] \cup [2.5, -3] \). #### Explanation of the Graph The graph visually represents how the function behaves over specific intervals. The presence of open and closed circles indicates whether the endpoint is included in the interval. A closed circle means the endpoint is included in the function's value at that point, whereas an open circle denotes it is not included. This type of graphical representation is useful for understanding where a function is defined and continuous, as well as identifying different behaviors and limits of the function across various segments of its domain.
### Understanding Piecewise Functions from Graphs #### Graph Description The graph shown represents a piecewise function \( g \) with two distinct intervals. It consists of two separate curve segments with their endpoints: 1. **First Segment**: - Starts with an open circle at \( (-3, -1) \). - The curve increases to a closed circle at \( (0, 4) \). 2. **Second Segment**: - Begins with a point, continuing from \( (1, 2.5) \). - The curve decreases to a closed circle at \( (5, -3) \). #### Domain and Range - **Domain**: The values of \( x \) for which the function is defined. In this case, the domain can be expressed as a union of intervals: \( (-3, 0] \cup [1, 5] \). - **Range**: The values of \( y \) that the function can take. Based on the graph, the range is \( [-1, 4] \cup [2.5, -3] \). #### Explanation of the Graph The graph visually represents how the function behaves over specific intervals. The presence of open and closed circles indicates whether the endpoint is included in the interval. A closed circle means the endpoint is included in the function's value at that point, whereas an open circle denotes it is not included. This type of graphical representation is useful for understanding where a function is defined and continuous, as well as identifying different behaviors and limits of the function across various segments of its domain.

Algebra and Trigonometry (6th Edition)
6th Edition
ISBN:9780134463216
Author:Robert F. Blitzer
Publisher:Robert F. Blitzer
ChapterP: Prerequisites: Fundamental Concepts Of Algebra
Section: Chapter Questions
Problem 1MCCP: In Exercises 1-25, simplify the given expression or perform the indicated operation (and simplify,...

Related questions
Question
![### Understanding Piecewise Functions from Graphs
#### Graph Description
The graph shown represents a piecewise function \( g \) with two distinct intervals. It consists of two separate curve segments with their endpoints:
1. **First Segment**:
- Starts with an open circle at \( (-3, -1) \).
- The curve increases to a closed circle at \( (0, 4) \).
2. **Second Segment**:
- Begins with a point, continuing from \( (1, 2.5) \).
- The curve decreases to a closed circle at \( (5, -3) \).
#### Domain and Range
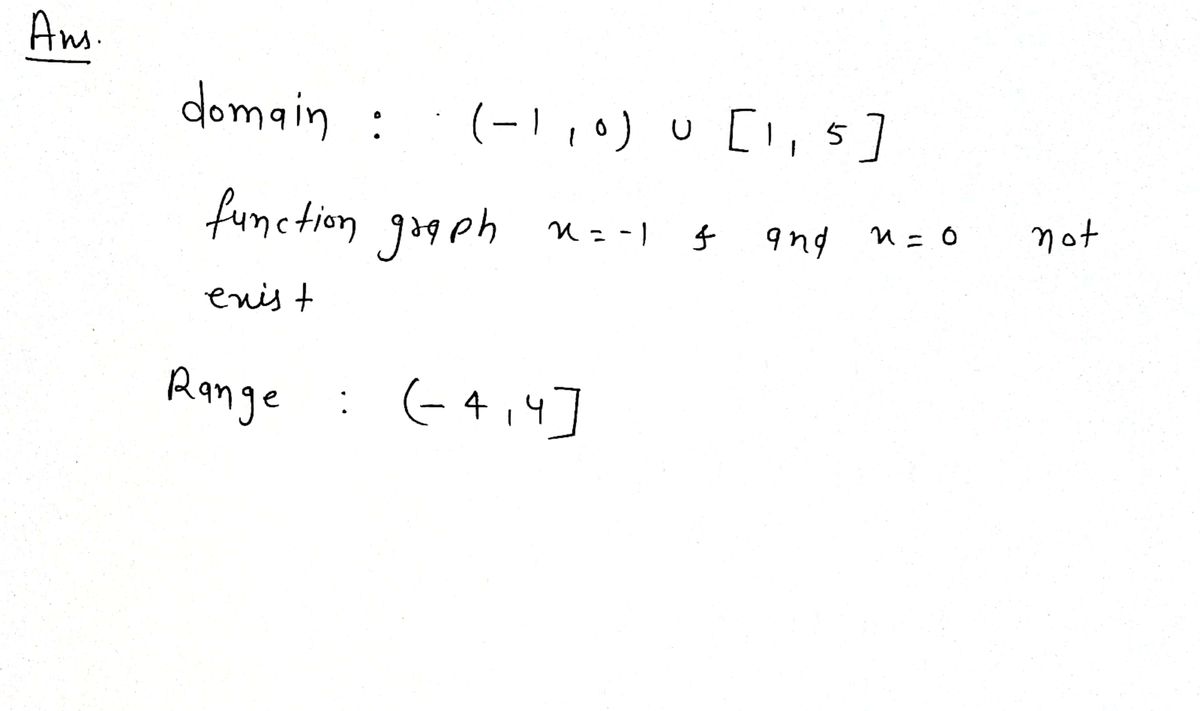
- **Domain**: The values of \( x \) for which the function is defined. In this case, the domain can be expressed as a union of intervals: \( (-3, 0] \cup [1, 5] \).
- **Range**: The values of \( y \) that the function can take. Based on the graph, the range is \( [-1, 4] \cup [2.5, -3] \).
#### Explanation of the Graph
The graph visually represents how the function behaves over specific intervals. The presence of open and closed circles indicates whether the endpoint is included in the interval. A closed circle means the endpoint is included in the function's value at that point, whereas an open circle denotes it is not included.
This type of graphical representation is useful for understanding where a function is defined and continuous, as well as identifying different behaviors and limits of the function across various segments of its domain.](/v2/_next/image?url=https%3A%2F%2Fcontent.bartleby.com%2Fqna-images%2Fquestion%2Fdd5f4c95-0302-4c6c-bf45-b7501007a997%2F5c432ba1-8fcd-418d-ac28-c017df6b9c9f%2Frxpmhjr.jpeg&w=3840&q=75)
Transcribed Image Text:### Understanding Piecewise Functions from Graphs
#### Graph Description
The graph shown represents a piecewise function \( g \) with two distinct intervals. It consists of two separate curve segments with their endpoints:
1. **First Segment**:
- Starts with an open circle at \( (-3, -1) \).
- The curve increases to a closed circle at \( (0, 4) \).
2. **Second Segment**:
- Begins with a point, continuing from \( (1, 2.5) \).
- The curve decreases to a closed circle at \( (5, -3) \).
#### Domain and Range
- **Domain**: The values of \( x \) for which the function is defined. In this case, the domain can be expressed as a union of intervals: \( (-3, 0] \cup [1, 5] \).
- **Range**: The values of \( y \) that the function can take. Based on the graph, the range is \( [-1, 4] \cup [2.5, -3] \).
#### Explanation of the Graph
The graph visually represents how the function behaves over specific intervals. The presence of open and closed circles indicates whether the endpoint is included in the interval. A closed circle means the endpoint is included in the function's value at that point, whereas an open circle denotes it is not included.
This type of graphical representation is useful for understanding where a function is defined and continuous, as well as identifying different behaviors and limits of the function across various segments of its domain.
Expert Solution
Step 1

Step by step
Solved in 2 steps with 1 images

Recommended textbooks for you
Algebra and Trigonometry (6th Edition)
Algebra
ISBN:
9780134463216
Author:
Robert F. Blitzer
Publisher:
PEARSON

Contemporary Abstract Algebra
Algebra
ISBN:
9781305657960
Author:
Joseph Gallian
Publisher:
Cengage Learning

Linear Algebra: A Modern Introduction
Algebra
ISBN:
9781285463247
Author:
David Poole
Publisher:
Cengage Learning
Algebra and Trigonometry (6th Edition)
Algebra
ISBN:
9780134463216
Author:
Robert F. Blitzer
Publisher:
PEARSON
Contemporary Abstract Algebra
Algebra
ISBN:
9781305657960
Author:
Joseph Gallian
Publisher:
Cengage Learning
Linear Algebra: A Modern Introduction
Algebra
ISBN:
9781285463247
Author:
David Poole
Publisher:
Cengage Learning

Algebra And Trigonometry (11th Edition)
Algebra
ISBN:
9780135163078
Author:
Michael Sullivan
Publisher:
PEARSON

Introduction to Linear Algebra, Fifth Edition
Algebra
ISBN:
9780980232776
Author:
Gilbert Strang
Publisher:
Wellesley-Cambridge Press

College Algebra (Collegiate Math)
Algebra
ISBN:
9780077836344
Author:
Julie Miller, Donna Gerken
Publisher:
McGraw-Hill Education