al Poly Pomona found that 15% of its students withdraw without completing Calculus I course. Assume that 30 students registered for the course. Let X be the number of students who withdraw. What distribution does X follow?
al Poly Pomona found that 15% of its students withdraw without completing Calculus I course. Assume that 30 students registered for the course. Let X be the number of students who withdraw. What distribution does X follow?

A First Course in Probability (10th Edition)
10th Edition
ISBN:9780134753119
Author:Sheldon Ross
Publisher:Sheldon Ross
Chapter1: Combinatorial Analysis
Section: Chapter Questions
Problem 1.1P: a. How many different 7-place license plates are possible if the first 2 places are for letters and...

Related questions
Question
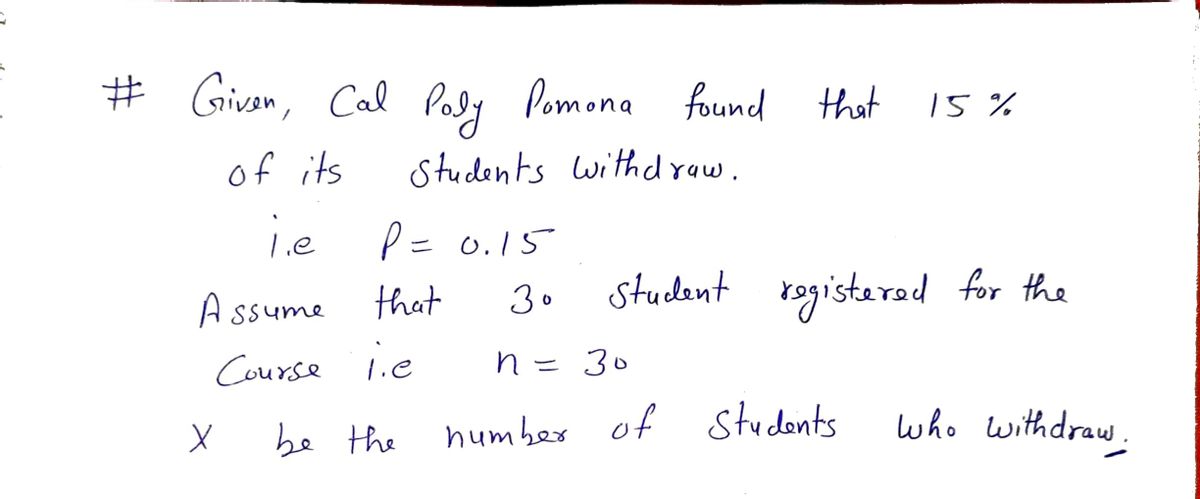
Cal Poly Pomona found that 15% of its students withdraw without completing Calculus I course.
Assume that 30 students registered for the course.
Let X be the number of students who withdraw. What distribution does X follow?
Expert Solution
Step 1

Step by step
Solved in 2 steps with 2 images

Recommended textbooks for you
A First Course in Probability (10th Edition)
Probability
ISBN:
9780134753119
Author:
Sheldon Ross
Publisher:
PEARSON

A First Course in Probability (10th Edition)
Probability
ISBN:
9780134753119
Author:
Sheldon Ross
Publisher:
PEARSON