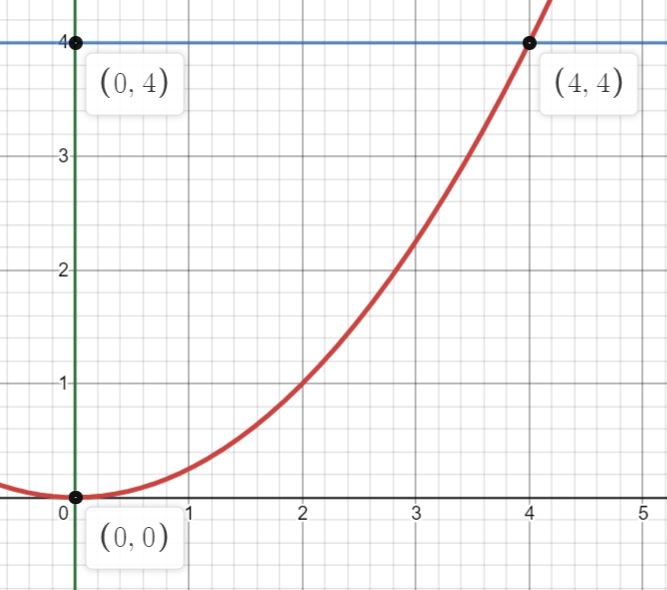
D 4 - x². It can be described in 16 The region D above lies between the two red lines and the red parabola y = two ways. 1. If we visualize the region having "top" and "bottom" boundaries, express each as functions of x and provide the interval of x-values that covers the entire region. "top" boundary g2(x) = "bottom" boundary g1(x) = interval of x values that covers the region 2. If we visualize the region having "right" and "left" boundaries, express each as functions of y and provide the interval of y-values that covers the entire region. "right" boundary f2(y) %3D "left" boundary fi(y) = interval of y values that covers the region
D 4 - x². It can be described in 16 The region D above lies between the two red lines and the red parabola y = two ways. 1. If we visualize the region having "top" and "bottom" boundaries, express each as functions of x and provide the interval of x-values that covers the entire region. "top" boundary g2(x) = "bottom" boundary g1(x) = interval of x values that covers the region 2. If we visualize the region having "right" and "left" boundaries, express each as functions of y and provide the interval of y-values that covers the entire region. "right" boundary f2(y) %3D "left" boundary fi(y) = interval of y values that covers the region

Advanced Engineering Mathematics
10th Edition
ISBN:9780470458365
Author:Erwin Kreyszig
Publisher:Erwin Kreyszig
Chapter2: Second-order Linear Odes
Section: Chapter Questions
Problem 1RQ

Related questions
Question
100%

Transcribed Image Text:D
4
- x². It can be described in
16
The region D above lies between the two red lines and the red parabola y =
two ways.
1. If we visualize the region having "top" and "bottom" boundaries, express each as functions of x and
provide the interval of x-values that covers the entire region.
"top" boundary g2(x) =
"bottom" boundary g1(x) =
interval of x values that covers the region
2. If we visualize the region having "right" and "left" boundaries, express each as functions of y and provide
the interval of y-values that covers the entire region.
"right" boundary f2(y)
%3D
"left" boundary fi(y) =
interval of y values that covers the region
Expert Solution
Step 1
Label the corner points of the region:
Step 2
Part 1:

Step by step
Solved in 4 steps with 1 images

Similar questions
Recommended textbooks for you
Advanced Engineering Mathematics
Advanced Math
ISBN:
9780470458365
Author:
Erwin Kreyszig
Publisher:
Wiley, John & Sons, Incorporated

Numerical Methods for Engineers
Advanced Math
ISBN:
9780073397924
Author:
Steven C. Chapra Dr., Raymond P. Canale
Publisher:
McGraw-Hill Education

Introductory Mathematics for Engineering Applicat…
Advanced Math
ISBN:
9781118141809
Author:
Nathan Klingbeil
Publisher:
WILEY
Advanced Engineering Mathematics
Advanced Math
ISBN:
9780470458365
Author:
Erwin Kreyszig
Publisher:
Wiley, John & Sons, Incorporated
Numerical Methods for Engineers
Advanced Math
ISBN:
9780073397924
Author:
Steven C. Chapra Dr., Raymond P. Canale
Publisher:
McGraw-Hill Education
Introductory Mathematics for Engineering Applicat…
Advanced Math
ISBN:
9781118141809
Author:
Nathan Klingbeil
Publisher:
WILEY

Mathematics For Machine Technology
Advanced Math
ISBN:
9781337798310
Author:
Peterson, John.
Publisher:
Cengage Learning,

