A commercial vegetable and fruit grower carefully observes the relationship between the amount of fertilizer used on a certain variety of pumpkin and the revenue made from sales of the resulting pumpkin crop, recorded in the following table Amount of Fertilizer |250 500 750 1000 1250 1500 1750 2000 (pounds/acre) --- Revenue earned 96 145 172 185 192 196 198 199 (dollars/acre) The fertilizer costs $0.14 per pound. What would you advise the grower is the most profitable amount of fertilizer to use? Check your advice by answering/calculating the following. • Is cach pound of fertilizer equally effective? Explain. • Graph the data and then estimate the maximum amount of revenue that can be earned per acre from your graph. Call this estimate c. • Compute a linear regression for the data. • Compute a logarithmic regression(LnReg) for the data. • Use trial and error on your calculator to fit a function of the form r = c(1 – b") where c is the estimate for the maximum amount of revenue and 0 < b < 1 • Choose the best model for revenue and then write a total cost function for fertilizer. Use graphs on your calculator to find where cost equals revenue. • Write a profit function and graph it to advise the grower on the most profitable amount of fertilizer to use.
A commercial vegetable and fruit grower carefully observes the relationship between the amount of fertilizer used on a certain variety of pumpkin and the revenue made from sales of the resulting pumpkin crop, recorded in the following table Amount of Fertilizer |250 500 750 1000 1250 1500 1750 2000 (pounds/acre) --- Revenue earned 96 145 172 185 192 196 198 199 (dollars/acre) The fertilizer costs $0.14 per pound. What would you advise the grower is the most profitable amount of fertilizer to use? Check your advice by answering/calculating the following. • Is cach pound of fertilizer equally effective? Explain. • Graph the data and then estimate the maximum amount of revenue that can be earned per acre from your graph. Call this estimate c. • Compute a linear regression for the data. • Compute a logarithmic regression(LnReg) for the data. • Use trial and error on your calculator to fit a function of the form r = c(1 – b") where c is the estimate for the maximum amount of revenue and 0 < b < 1 • Choose the best model for revenue and then write a total cost function for fertilizer. Use graphs on your calculator to find where cost equals revenue. • Write a profit function and graph it to advise the grower on the most profitable amount of fertilizer to use.

MATLAB: An Introduction with Applications
6th Edition
ISBN:9781119256830
Author:Amos Gilat
Publisher:Amos Gilat
Chapter1: Starting With Matlab
Section: Chapter Questions
Problem 1P

Related questions
Topic Video
Question
Choose the best model for revenue and then write a total cost

Transcribed Image Text:A commercial vegetable and fruit grower carefully observes the relationship between the amount of
fertilizer used on a certain variety of pumpkin and the revenue made from sales of the resulting
pumpkin crop, recorded in the following table
Amount of
Fertilizer
|250 500 750 1000 1250 1500 1750 2000
(pounds/acre)
---
Revenue
earned
96 145 172 185 192 196 198
199
(dollars/acre)
The fertilizer costs $0.14 per pound. What would you advise the grower is the most profitable amount
of fertilizer to use? Check your advice by answering/calculating the following.
• Is cach pound of fertilizer equally effective? Explain.
• Graph the data and then estimate the maximum amount of revenue that can be earned per acre
from your graph. Call this estimate c.
• Compute a linear regression for the data.
• Compute a logarithmic regression(LnReg) for the data.
• Use trial and error on your calculator to fit a function of the form r = c(1 – b") where c is
the estimate for the maximum amount of revenue and 0 < b < 1
• Choose the best model for revenue and then write a total cost function for fertilizer. Use graphs
on your calculator to find where cost equals revenue.
• Write a profit function and graph it to advise the grower on the most profitable amount of
fertilizer to use.
Expert Solution
Step 1
Since you have asked multiple sub-parts, we will answer the first three sub-parts for you. If you need answer to specific sub-parts, please re-post and mention them.
a) As the amount of fertilizer increases, the revenue also increases. This can be validated using the Correlation coefficient from the data.
Click on Data Analysis>Correlation > Select Input and Output Range> Click OK.
The output is shown below:
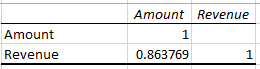
The correlation coefficient is 0.863769, which means as the amount of fertilizer increases, the revenue also increases.

Step by step
Solved in 3 steps with 3 images

Knowledge Booster


Learn more about
Need a deep-dive on the concept behind this application? Look no further. Learn more about this topic, statistics and related others by exploring similar questions and additional content below.Recommended textbooks for you
MATLAB: An Introduction with Applications
Statistics
ISBN:
9781119256830
Author:
Amos Gilat
Publisher:
John Wiley & Sons Inc

Probability and Statistics for Engineering and th…
Statistics
ISBN:
9781305251809
Author:
Jay L. Devore
Publisher:
Cengage Learning

Statistics for The Behavioral Sciences (MindTap C…
Statistics
ISBN:
9781305504912
Author:
Frederick J Gravetter, Larry B. Wallnau
Publisher:
Cengage Learning
MATLAB: An Introduction with Applications
Statistics
ISBN:
9781119256830
Author:
Amos Gilat
Publisher:
John Wiley & Sons Inc
Probability and Statistics for Engineering and th…
Statistics
ISBN:
9781305251809
Author:
Jay L. Devore
Publisher:
Cengage Learning
Statistics for The Behavioral Sciences (MindTap C…
Statistics
ISBN:
9781305504912
Author:
Frederick J Gravetter, Larry B. Wallnau
Publisher:
Cengage Learning

Elementary Statistics: Picturing the World (7th E…
Statistics
ISBN:
9780134683416
Author:
Ron Larson, Betsy Farber
Publisher:
PEARSON

The Basic Practice of Statistics
Statistics
ISBN:
9781319042578
Author:
David S. Moore, William I. Notz, Michael A. Fligner
Publisher:
W. H. Freeman

Introduction to the Practice of Statistics
Statistics
ISBN:
9781319013387
Author:
David S. Moore, George P. McCabe, Bruce A. Craig
Publisher:
W. H. Freeman