Accordingly, let us assume you have a computer program that gives you random numbers between 1 and 10 (e.g. 1.45). All numbers have the same chance to be drawn. The distribution is uniform (or flat). If you take samples with 100 scores in each sample, how does the shape of the distribution of sample means qualitatively look like? If you take samples that consists of a single score such that the sample mean of each sample is given by its score, how does the shape of the distribution of sample means look like? What happens between these two extreme cases? I.e., what happens with the shape of the distribution of sample means if you increase the sample size from a sample size of 1 towards a sample size of 100
Accordingly, let us assume you have a computer program that gives you random numbers between 1 and 10 (e.g. 1.45). All numbers have the same chance to be drawn. The distribution is uniform (or flat). If you take samples with 100 scores in each sample, how does the shape of the distribution of sample means qualitatively look like? If you take samples that consists of a single score such that the sample
From the given information,
It is provided to us that computer program produce random numbers between 1 to 10 ( i.e any number number like 2,1.45 ,4 etc).
Further, all random numbers have the probability of equally being selected as the distribution is uniform.
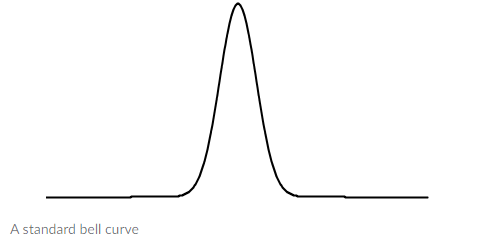
A distribution of values that cluster around an average (referred to as the “mean”) is known as a “normal” distribution.

Step by step
Solved in 2 steps with 3 images


