According to the attached normal distribution graph, which are the z-scores of the graph: a) -1,96 and 1,96 b) -1,65 and 1,65 c) -1,64 and 1,64 d) -0,07 and 0,07
According to the attached normal distribution graph, which are the z-scores of the graph: a) -1,96 and 1,96 b) -1,65 and 1,65 c) -1,64 and 1,64 d) -0,07 and 0,07

A First Course in Probability (10th Edition)
10th Edition
ISBN:9780134753119
Author:Sheldon Ross
Publisher:Sheldon Ross
Chapter1: Combinatorial Analysis
Section: Chapter Questions
Problem 1.1P: a. How many different 7-place license plates are possible if the first 2 places are for letters and...

Related questions

Question
According to the attached
a) -1,96 and 1,96
b) -1,65 and 1,65
c) -1,64 and 1,64
d) -0,07 and 0,07

Expert Solution
Step 1
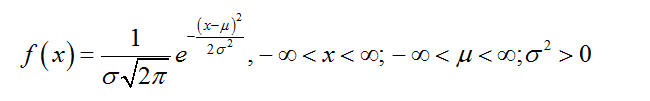
The normal distribution:
A continuous random variable X is said to follow normal distribution with mean µ and standard deviation σ if the probability density function of X is,
Step 2
It is given that area between 0 and z is 0.475.
It is known that area below (or above) to the point 0 in a standard normal curve is 0.50.
Thus, area between -∞ and lower z is 0.5-0.475 =0.025.
Consider the standard normal table given below:
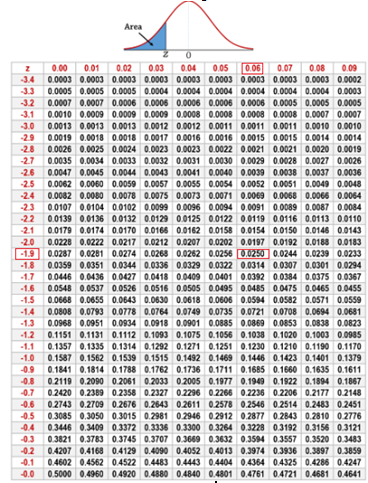
From the above table lower value of z is -1.96.

Step by step
Solved in 4 steps with 3 images

Knowledge Booster


Learn more about
Need a deep-dive on the concept behind this application? Look no further. Learn more about this topic, probability and related others by exploring similar questions and additional content below.Recommended textbooks for you
A First Course in Probability (10th Edition)
Probability
ISBN:
9780134753119
Author:
Sheldon Ross
Publisher:
PEARSON

A First Course in Probability (10th Edition)
Probability
ISBN:
9780134753119
Author:
Sheldon Ross
Publisher:
PEARSON