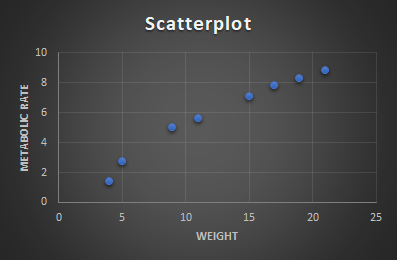
а. Use Excel to make a scatter diagram with a best fit hand drawn line through the points. Tape your diagram below. Remember to add title and axis labels. b. Do you think the correlation is a) low, moderate or strong? b) Positive or negative? Ans. a Ans. b С. Use Excel to a) determine the correlation coefficient, b) does this coefficient imply that will increase or decrease as x increases? Ans, a Ans, b


Correlation
Correlation defines a relationship between two independent variables. It tells the degree to which variables move in relation to each other. When two sets of data are related to each other, there is a correlation between them.
Linear Correlation
A correlation is used to determine the relationships between numerical and categorical variables. In other words, it is an indicator of how things are connected to one another. The correlation analysis is the study of how variables are related.
Regression Analysis
Regression analysis is a statistical method in which it estimates the relationship between a dependent variable and one or more independent variable. In simple terms dependent variable is called as outcome variable and independent variable is called as predictors. Regression analysis is one of the methods to find the trends in data. The independent variable used in Regression analysis is named Predictor variable. It offers data of an associated dependent variable regarding a particular outcome.

| X | Y | (x-xbar) | (x-xbar)^2 | (y-ybar) | (y-ybar)^2 | (x-xbar)*(y-ybar) |
| 4 | 1.4 | -8.6250 | 74.3906 | -4.4375 | 19.6914 | 38.2734 |
| 5 | 2.7 | -7.6250 | 58.1406 | -3.1375 | 9.8439 | 23.9234 |
| 9 | 5 | -3.6250 | 13.1406 | -0.8375 | 0.7014 | 3.0359 |
| 11 | 5.6 | -1.6250 | 2.6406 | -0.2375 | 0.0564 | 0.3859 |
| 15 | 7.1 | 2.3750 | 5.6406 | 1.2625 | 1.5939 | 2.9984 |
| 17 | 7.8 | 4.3750 | 19.1406 | 1.9625 | 3.8514 | 8.5859 |
| 19 | 8.3 | 6.3750 | 40.6406 | 2.4625 | 6.0639 | 15.6984 |
| 21 | 8.8 | 8.3750 | 70.1406 | 2.9625 | 8.7764 | 24.8109 |
a)

Step by step
Solved in 3 steps with 4 images


