A. Compute a correlation matrix. B. Develop a regression equation. Round 2 decimal places. C. Complete the Anova table. D. State your decision regarding the null hypothesis.

MATLAB: An Introduction with Applications
6th Edition
ISBN:9781119256830
Author:Amos Gilat
Publisher:Amos Gilat
Chapter1: Starting With Matlab
Section: Chapter Questions
Problem 1P
icon
Related questions
icon
Concept explainers
Question
A. Compute a correlation matrix. B. Develop a regression equation. Round 2 decimal places. C. Complete the Anova table. D. State your decision regarding the null hypothesis.
wants to study adding more stores in this region. He believes there are two main factors that indicate the amount families spend on
groceries. The first is their income and the other is the number of people in the family. The director gathered the following sample
information.
Family
Food
Income
Size
$ 73.98
54.90
$5.04
4
4.08
3.
5.76
94.14
4.
4.
3.48
4.20
52.02
1
65.70
6.
4.80
53.64
4.
4.32
79.74
3.
5.04
68.58
4.
6.12
165.60
10
3.24
64.80
1
11
4.80
138.42
3
12
3.24
125.82
1
13
6.60
77.58
14
4.92
171.36
15
6.60
82.08
141.30
36.90
16
5.40
17
6.00
5.
18
5.40
56.88
4.
19
3.36
71.82
1.
4.68
4.32
20
69.48
3
21
54.36
22
5.52
87.66
4.56
5.40
4.80
38.16
43.74
48.42
23
3.
24
7.
25
Food and income are reported in thousands of dollars per year, and the variable size refers to the number of people in the household.
************
E Click here for the Excel Data File:
a-1. Develop a correlation matrix. (Negative amounts should be indicated by a minus sign. Round your answers to 3 decimal
places.)
< Prev
Next >
2 of 10
Transcribed Image Text:wants to study adding more stores in this region. He believes there are two main factors that indicate the amount families spend on groceries. The first is their income and the other is the number of people in the family. The director gathered the following sample information. Family Food Income Size $ 73.98 54.90 $5.04 4 4.08 3. 5.76 94.14 4. 4. 3.48 4.20 52.02 1 65.70 6. 4.80 53.64 4. 4.32 79.74 3. 5.04 68.58 4. 6.12 165.60 10 3.24 64.80 1 11 4.80 138.42 3 12 3.24 125.82 1 13 6.60 77.58 14 4.92 171.36 15 6.60 82.08 141.30 36.90 16 5.40 17 6.00 5. 18 5.40 56.88 4. 19 3.36 71.82 1. 4.68 4.32 20 69.48 3 21 54.36 22 5.52 87.66 4.56 5.40 4.80 38.16 43.74 48.42 23 3. 24 7. 25 Food and income are reported in thousands of dollars per year, and the variable size refers to the number of people in the household. ************ E Click here for the Excel Data File: a-1. Develop a correlation matrix. (Negative amounts should be indicated by a minus sign. Round your answers to 3 decimal places.) < Prev Next > 2 of 10
Expert Solution
Step 1

Part a:

We compute the correlation matrix using the step by step procedure in excel as below:

  • Enter data into excel sheet.
  • Go to Data > Data Analysis > Correlation > Click OK.
  • Enter the input range and other values as given in the dialogue box below and click OK.

Statistics homework question answer, step 1, image 1

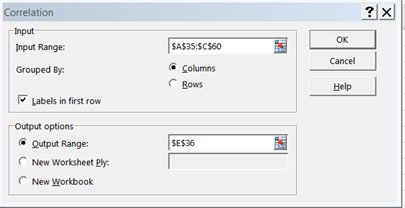
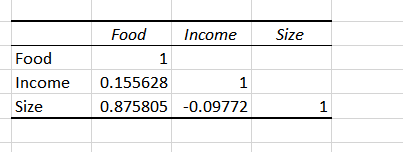
The output will be displayed as below:

Statistics homework question answer, step 1, image 2

steps

Step by step

Solved in 4 steps with 4 images

Blurred answer
Knowledge Booster
Correlation, Regression, and Association
Learn more about
Need a deep-dive on the concept behind this application? Look no further. Learn more about this topic, statistics and related others by exploring similar questions and additional content below.
Similar questions
Recommended textbooks for you
MATLAB: An Introduction with Applications
Statistics
ISBN:
9781119256830
Author:
Amos Gilat
Publisher:
John Wiley & Sons Inc
Probability and Statistics for Engineering and th…
Statistics
ISBN:
9781305251809
Author:
Jay L. Devore
Publisher:
Cengage Learning
Statistics for The Behavioral Sciences (MindTap C…
Statistics
ISBN:
9781305504912
Author:
Frederick J Gravetter, Larry B. Wallnau
Publisher:
Cengage Learning
Elementary Statistics: Picturing the World (7th E…
Statistics
ISBN:
9780134683416
Author:
Ron Larson, Betsy Farber
Publisher:
PEARSON
The Basic Practice of Statistics
Statistics
ISBN:
9781319042578
Author:
David S. Moore, William I. Notz, Michael A. Fligner
Publisher:
W. H. Freeman
Introduction to the Practice of Statistics
Statistics
ISBN:
9781319013387
Author:
David S. Moore, George P. McCabe, Bruce A. Craig
Publisher:
W. H. Freeman