a. (*) Calculate p. b. (**) Set up a p chart to track the proportion of late arriv- als. (Note: Each sample consists of 30 observations.) c. (***) Airline travel is characterized by busy and slow seasons. As a result, what is "normal" during one time of the year wouldn't be “normal” at some other time. What difficulties might arise as a result of using a single control chart to track the propor- tion of late arrivals? What could Central Airlines do about this?
a. (*) Calculate p. b. (**) Set up a p chart to track the proportion of late arriv- als. (Note: Each sample consists of 30 observations.) c. (***) Airline travel is characterized by busy and slow seasons. As a result, what is "normal" during one time of the year wouldn't be “normal” at some other time. What difficulties might arise as a result of using a single control chart to track the propor- tion of late arrivals? What could Central Airlines do about this?

MATLAB: An Introduction with Applications
6th Edition
ISBN:9781119256830
Author:Amos Gilat
Publisher:Amos Gilat
Chapter1: Starting With Matlab
Section: Chapter Questions
Problem 1P

Related questions
Question
These questions are together

Transcribed Image Text:a. (*) Calculate \( \bar{p} \).
b. (**) Set up a \( p \) chart to track the proportion of late arrivals. (*Note: Each sample consists of 30 observations.*)
c. (***) Airline travel is characterized by busy and slow seasons. As a result, what is "normal" during one time of the year wouldn’t be "normal" at some other time. What difficulties might arise as a result of using a single control chart to track the proportion of late arrivals? What could Central Airlines do about this?

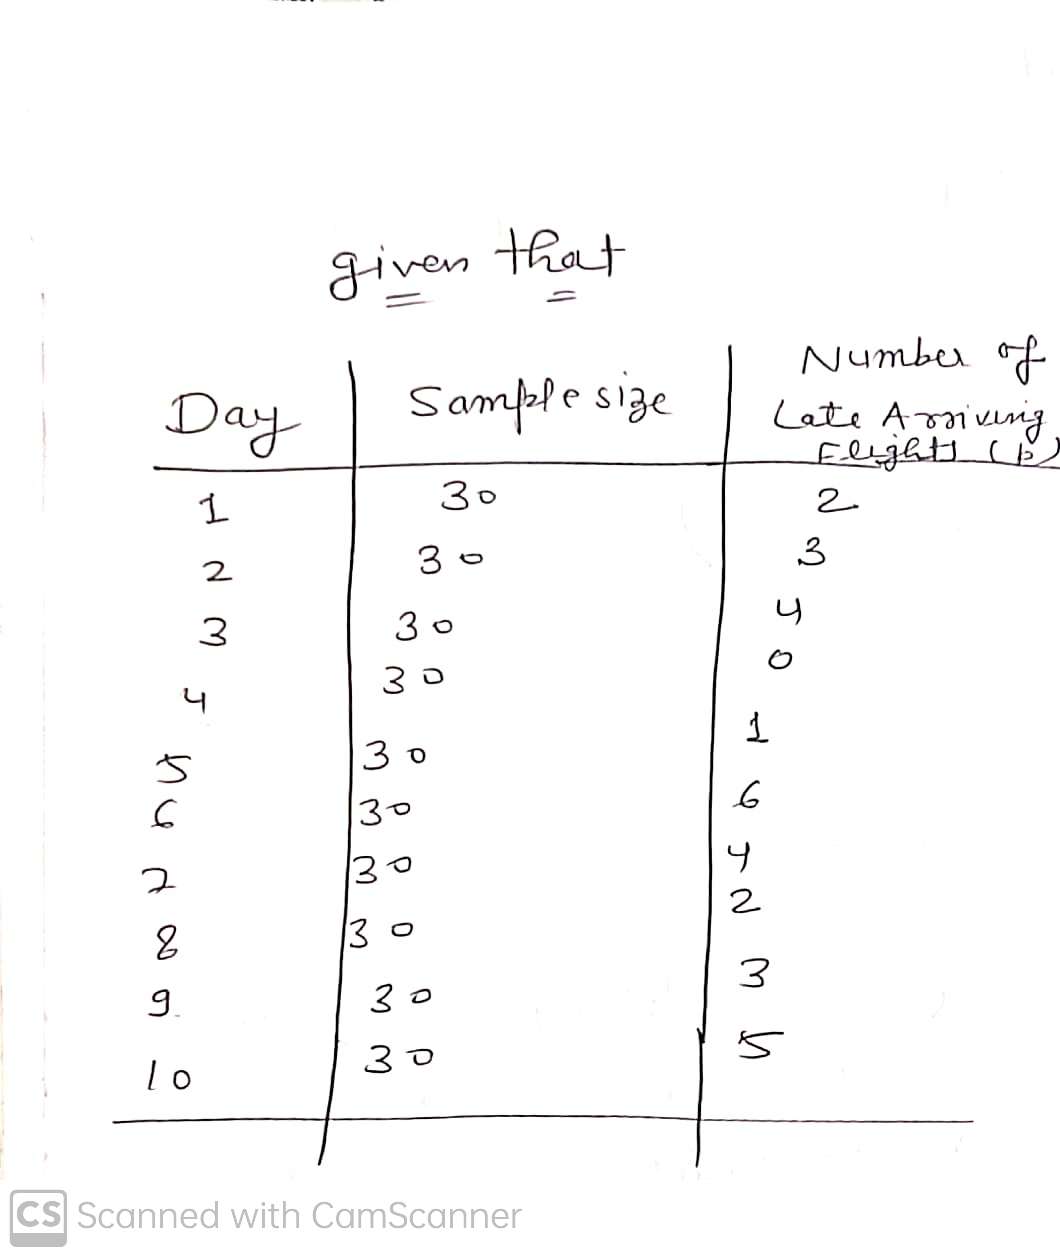
Transcribed Image Text:**Monitoring On-Time Arrival Performance at Central Airlines**
Central Airlines aimed to assess its on-time arrival performance by creating a control chart. Over a 10-day period, the airline randomly selected 30 flights each day and monitored the number of flights that arrived late. Below are the results of this data collection:
| DAY | SAMPLE SIZE | NUMBER OF LATE-ARRIVING FLIGHTS |
|-----|-------------|---------------------------------|
| 1 | 30 | 2 |
| 2 | 30 | 3 |
| 3 | 30 | 4 |
| 4 | 30 | 0 |
| 5 | 30 | 1 |
| 6 | 30 | 6 |
| 7 | 30 | 4 |
| 8 | 30 | 2 |
| 9 | 30 | 3 |
| 10 | 30 | 5 |
The table illustrates the consistency and variability in the number of late arrivals across the ten days sampled. These results could be used to identify potential areas for improvement in the airline's scheduling and operations procedures.
Expert Solution
Step 1
Given that
We have to find
a. Calculate p(bar)
b. Set up a p chart to track the proportion of late arriv als.
c. Airline travel is characterized by busy and slow seasons. As a result, what is "normal" during one time of the year wouldn't be "normal" at some other time. What difficulties might arise as a result of using a single control chart to track the propor tion of late arrivals? What could Central Airlines do about this?

Step by step
Solved in 3 steps with 3 images

Recommended textbooks for you
MATLAB: An Introduction with Applications
Statistics
ISBN:
9781119256830
Author:
Amos Gilat
Publisher:
John Wiley & Sons Inc

Probability and Statistics for Engineering and th…
Statistics
ISBN:
9781305251809
Author:
Jay L. Devore
Publisher:
Cengage Learning

Statistics for The Behavioral Sciences (MindTap C…
Statistics
ISBN:
9781305504912
Author:
Frederick J Gravetter, Larry B. Wallnau
Publisher:
Cengage Learning
MATLAB: An Introduction with Applications
Statistics
ISBN:
9781119256830
Author:
Amos Gilat
Publisher:
John Wiley & Sons Inc
Probability and Statistics for Engineering and th…
Statistics
ISBN:
9781305251809
Author:
Jay L. Devore
Publisher:
Cengage Learning
Statistics for The Behavioral Sciences (MindTap C…
Statistics
ISBN:
9781305504912
Author:
Frederick J Gravetter, Larry B. Wallnau
Publisher:
Cengage Learning

Elementary Statistics: Picturing the World (7th E…
Statistics
ISBN:
9780134683416
Author:
Ron Larson, Betsy Farber
Publisher:
PEARSON

The Basic Practice of Statistics
Statistics
ISBN:
9781319042578
Author:
David S. Moore, William I. Notz, Michael A. Fligner
Publisher:
W. H. Freeman

Introduction to the Practice of Statistics
Statistics
ISBN:
9781319013387
Author:
David S. Moore, George P. McCabe, Bruce A. Craig
Publisher:
W. H. Freeman