(a) Use a calculator with mean and standard deviation keys to verity that N and (Round your answers to four decimal places.) ppm pom pom ppm () Let , be the population mean for , and tet be the population mean for Fnd an Bo contdence interval for a, (Meund your answers to ane decimal place) lower limit X pom upper im X ppm
(a) Use a calculator with mean and standard deviation keys to verity that N and (Round your answers to four decimal places.) ppm pom pom ppm () Let , be the population mean for , and tet be the population mean for Fnd an Bo contdence interval for a, (Meund your answers to ane decimal place) lower limit X pom upper im X ppm

MATLAB: An Introduction with Applications
6th Edition
ISBN:9781119256830
Author:Amos Gilat
Publisher:Amos Gilat
Chapter1: Starting With Matlab
Section: Chapter Questions
Problem 1P

Related questions

Concept explainers
Contingency Table
A contingency table can be defined as the visual representation of the relationship between two or more categorical variables that can be evaluated and registered. It is a categorical version of the scatterplot, which is used to investigate the linear relationship between two variables. A contingency table is indeed a type of frequency distribution table that displays two variables at the same time.
Binomial Distribution
Binomial is an algebraic expression of the sum or the difference of two terms. Before knowing about binomial distribution, we must know about the binomial theorem.
Topic Video
Question

Transcribed Image Text:Inorganic phosphorous is a naturally occurring element in all plants and animals, with concentrations increasing progressively up the food chain (fruit < vegetables < cereaise
nuts < corpse). Geochemical surveys take soil samples to determine phosphorous content (in ppm, parts per million). A high phosphorous content may or may not indicate an
ancient burial site, food storage site, or even a garbage dump. Independent random samples from two regions gave the following phosphorous measurements (in ppm).
Assume the distribution of phosphorous is mound-shaped and symmetric for these two regions.
Region It x n, 15
857
1,551 1,230
875
1,080 2,330 1,850 1,860
2,340 1,080
910
1,130 1,450 1,260
1,010
Region III xi n 14
542 B06
1,230 1,770
790
960
1,650 860
890 640 1,180 1,160 1,050 1,020
A USE SALT
(a) Use a caiculator with mean and standard deviation keys to verify that a and s (Round your answers to four decimal places.)
ppm
ppm
ppm
ppm
(b) Let , be the population mean for x, and let be the population mean for . Find an 80% confidence interval for -. (Round your answers to ane decimal place.)
lower limit
X pom
upper ima
X ppm
Expert Solution
Step 1
For Region 1 :
| N: | 15 |
| Sum, Σx: | 20813 |
| Mean, x̄1 = Σx/N | 1387.5333 |
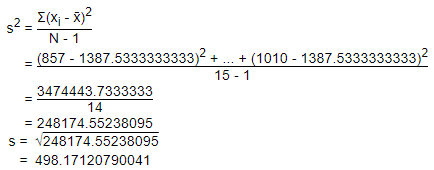
Standard Deviation, s1 = 498.171

Step by step
Solved in 2 steps with 2 images

Knowledge Booster


Learn more about
Need a deep-dive on the concept behind this application? Look no further. Learn more about this topic, statistics and related others by exploring similar questions and additional content below.Recommended textbooks for you
MATLAB: An Introduction with Applications
Statistics
ISBN:
9781119256830
Author:
Amos Gilat
Publisher:
John Wiley & Sons Inc

Probability and Statistics for Engineering and th…
Statistics
ISBN:
9781305251809
Author:
Jay L. Devore
Publisher:
Cengage Learning

Statistics for The Behavioral Sciences (MindTap C…
Statistics
ISBN:
9781305504912
Author:
Frederick J Gravetter, Larry B. Wallnau
Publisher:
Cengage Learning
MATLAB: An Introduction with Applications
Statistics
ISBN:
9781119256830
Author:
Amos Gilat
Publisher:
John Wiley & Sons Inc
Probability and Statistics for Engineering and th…
Statistics
ISBN:
9781305251809
Author:
Jay L. Devore
Publisher:
Cengage Learning
Statistics for The Behavioral Sciences (MindTap C…
Statistics
ISBN:
9781305504912
Author:
Frederick J Gravetter, Larry B. Wallnau
Publisher:
Cengage Learning

Elementary Statistics: Picturing the World (7th E…
Statistics
ISBN:
9780134683416
Author:
Ron Larson, Betsy Farber
Publisher:
PEARSON

The Basic Practice of Statistics
Statistics
ISBN:
9781319042578
Author:
David S. Moore, William I. Notz, Michael A. Fligner
Publisher:
W. H. Freeman

Introduction to the Practice of Statistics
Statistics
ISBN:
9781319013387
Author:
David S. Moore, George P. McCabe, Bruce A. Craig
Publisher:
W. H. Freeman