A teachers’ analysis of statistics exams found the exam scores had a normal distribution with mean µ = 70 and a standard deviation σ = 5. The passing cutoff for the exam is one standard deviation below the mean, or µ − σ. (a) In a class with 60 students, how many students will pass? Draw a normal curve and shade in the relevant area, and be sure to indicate how you calculated the relevant area. (b) Suppose the teacher will give an A to anyone whose score is at least 2 standard deviations above the mean (so scores above µ + 2σ). How many students (of the same 60) will get an A in this case?


A teachers’ analysis of statistics exams found the exam scores had a
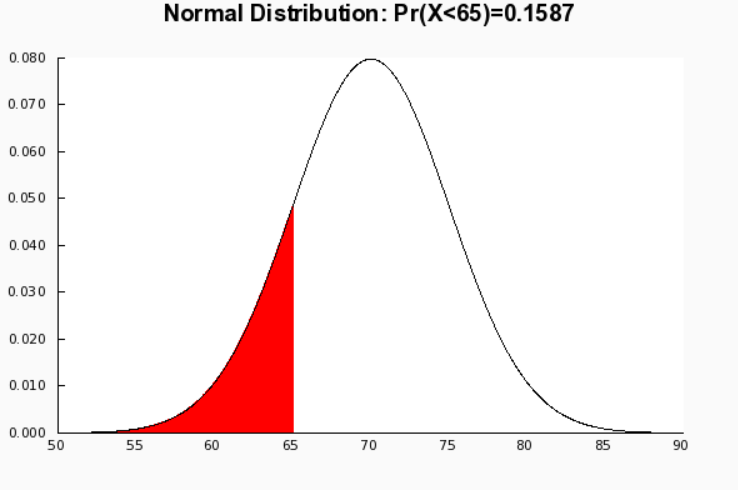
(a) In a class with 60 students, how many students will pass? Draw a normal curve and shade in the relevant area, and be sure to indicate how you calculated the relevant area.
(b) Suppose the teacher will give an A to anyone whose score is at least 2 standard deviations above the mean (so scores above µ + 2σ). How many students (of the same 60) will get an A in this case?
Given :
a)
passing cutoff for the exam is one standard deviation below the mean, or µ − σ.
n = 60
In a class with 60 students, 10 students will pass.

Step by step
Solved in 4 steps with 2 images


