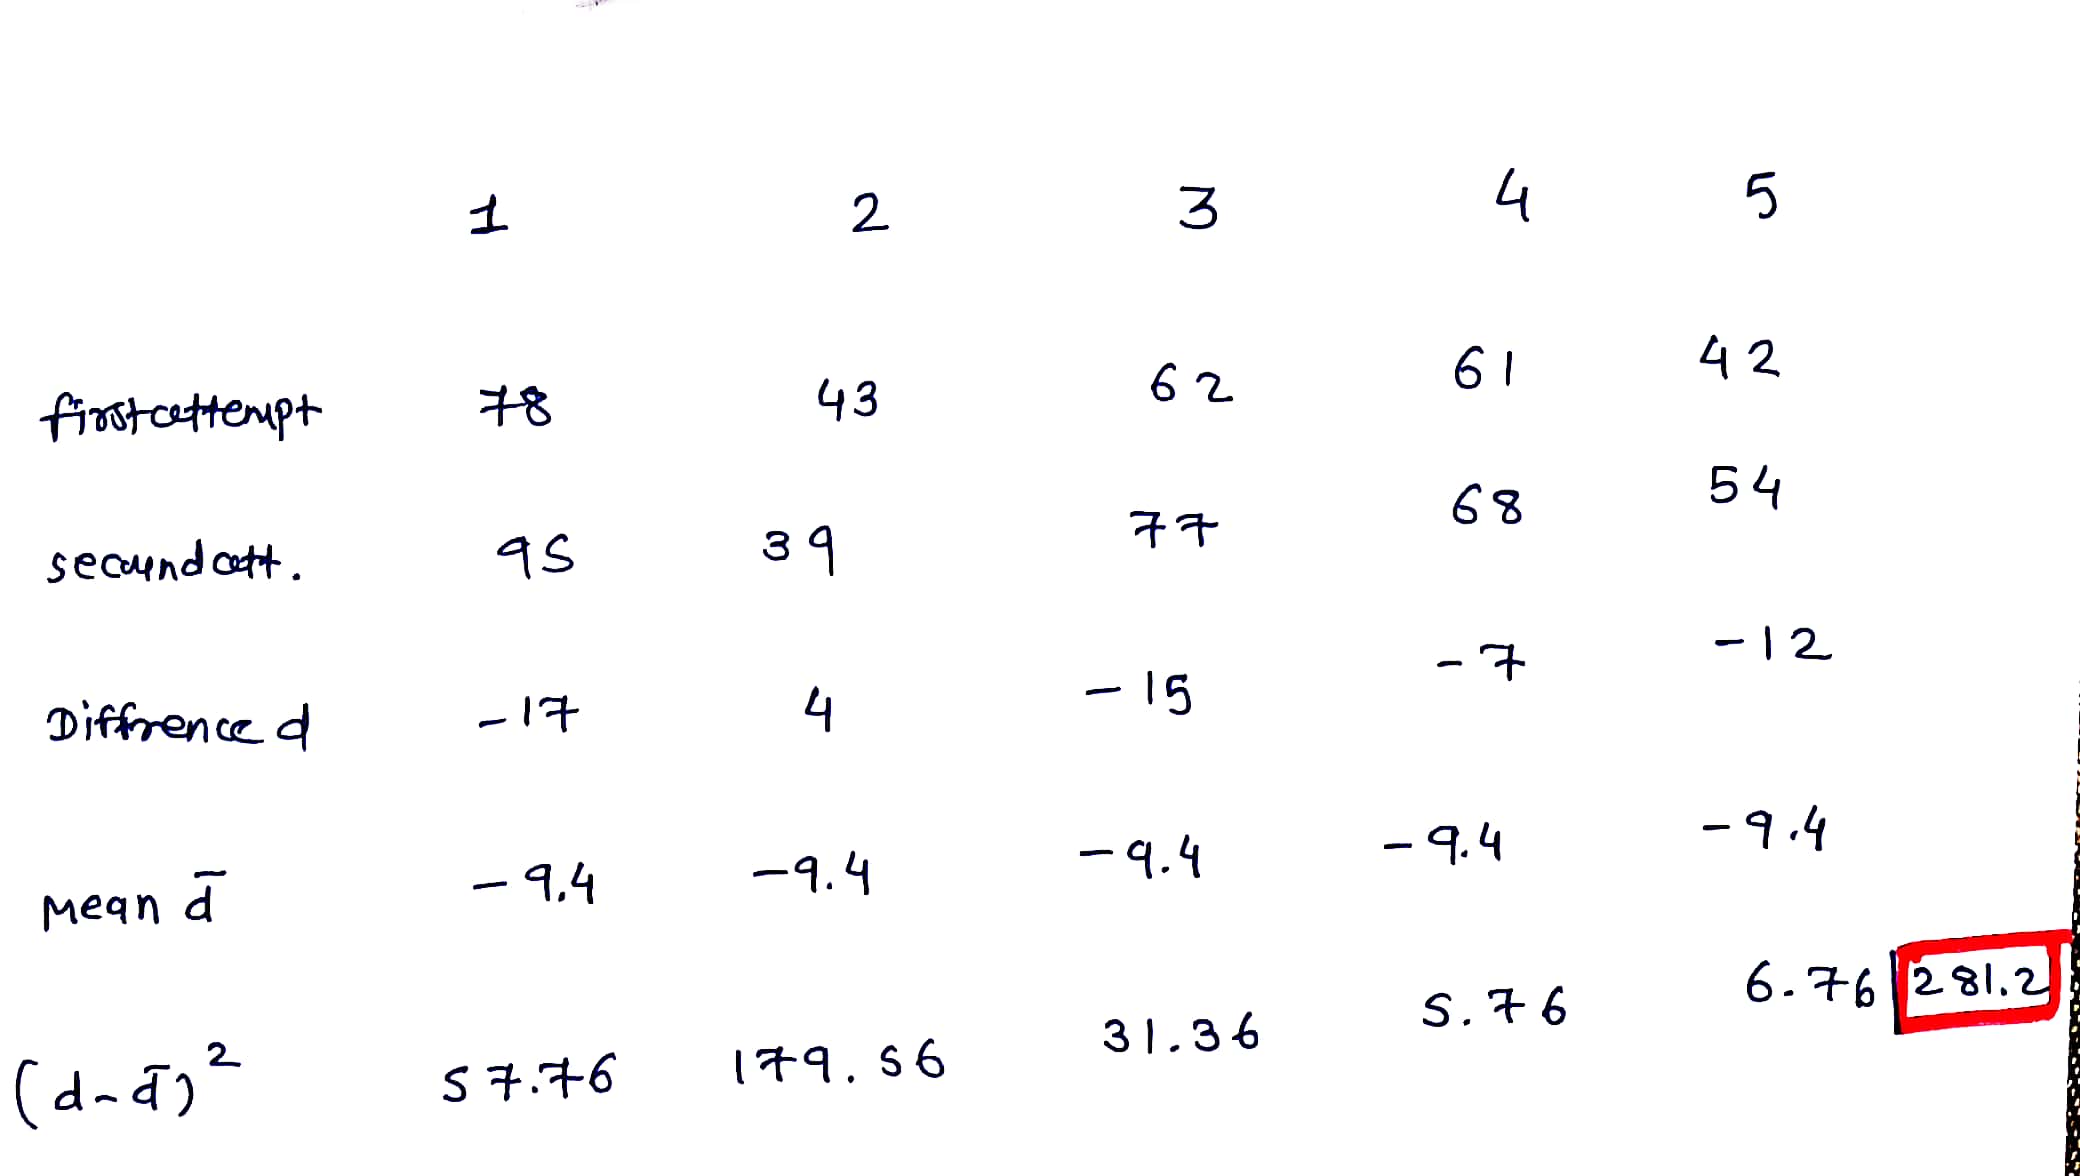
A teacher claims that students do better on a second attempt of a test. The following data represents the first and second attempt at the same test for five students. Assume the data is normally distributed. Is there enough evidence to support the claim at a 0.10 level of significance? Complete the table, then find the standard deviation of the difference sa 4 First Attempt 78 43 62 61 42 Second Attempt 95 39 77 68 54 Difference d Mean d (P-P) Standard Deviation t-Test Statistic Degrees of Freedom Prl -P n-1 = Ps n-1 Round all values to 3 decimal places a. The standard deviation sa = b. t test statistic = C. At the 0.10 level, the critical value t =
A teacher claims that students do better on a second attempt of a test. The following data represents the first and second attempt at the same test for five students. Assume the data is normally distributed. Is there enough evidence to support the claim at a 0.10 level of significance? Complete the table, then find the standard deviation of the difference sa 4 First Attempt 78 43 62 61 42 Second Attempt 95 39 77 68 54 Difference d Mean d (P-P) Standard Deviation t-Test Statistic Degrees of Freedom Prl -P n-1 = Ps n-1 Round all values to 3 decimal places a. The standard deviation sa = b. t test statistic = C. At the 0.10 level, the critical value t =

MATLAB: An Introduction with Applications
6th Edition
ISBN:9781119256830
Author:Amos Gilat
Publisher:Amos Gilat
Chapter1: Starting With Matlab
Section: Chapter Questions
Problem 1P

Related questions
Question

Transcribed Image Text:A teacher claims that students do better on a second attempt of a test. The following data represents the
first and second attempt at the same test for five students. Assume the data is normally distributed. Is
there enough evidence to support the claim at a 0.10 level of significance?
Complete the table, then find the standard deviation of the difference sa
4
First Attempt
78
43
62
61
42
Second Attempt
95
39
77
68
54
Difference d
Mean d
(P- P)
Standard Deviation
t-Test Statistic Degrees of Freedom
d - Hd
n-1
1
Round all values to 3 decimal places
a. The standard deviation sa =
b. t test statistic =
C. At the 0.10 level, the critical value t =
Expert Solution
Step 1

Step by step
Solved in 3 steps with 3 images

Recommended textbooks for you
MATLAB: An Introduction with Applications
Statistics
ISBN:
9781119256830
Author:
Amos Gilat
Publisher:
John Wiley & Sons Inc

Probability and Statistics for Engineering and th…
Statistics
ISBN:
9781305251809
Author:
Jay L. Devore
Publisher:
Cengage Learning

Statistics for The Behavioral Sciences (MindTap C…
Statistics
ISBN:
9781305504912
Author:
Frederick J Gravetter, Larry B. Wallnau
Publisher:
Cengage Learning
MATLAB: An Introduction with Applications
Statistics
ISBN:
9781119256830
Author:
Amos Gilat
Publisher:
John Wiley & Sons Inc
Probability and Statistics for Engineering and th…
Statistics
ISBN:
9781305251809
Author:
Jay L. Devore
Publisher:
Cengage Learning
Statistics for The Behavioral Sciences (MindTap C…
Statistics
ISBN:
9781305504912
Author:
Frederick J Gravetter, Larry B. Wallnau
Publisher:
Cengage Learning

Elementary Statistics: Picturing the World (7th E…
Statistics
ISBN:
9780134683416
Author:
Ron Larson, Betsy Farber
Publisher:
PEARSON

The Basic Practice of Statistics
Statistics
ISBN:
9781319042578
Author:
David S. Moore, William I. Notz, Michael A. Fligner
Publisher:
W. H. Freeman

Introduction to the Practice of Statistics
Statistics
ISBN:
9781319013387
Author:
David S. Moore, George P. McCabe, Bruce A. Craig
Publisher:
W. H. Freeman