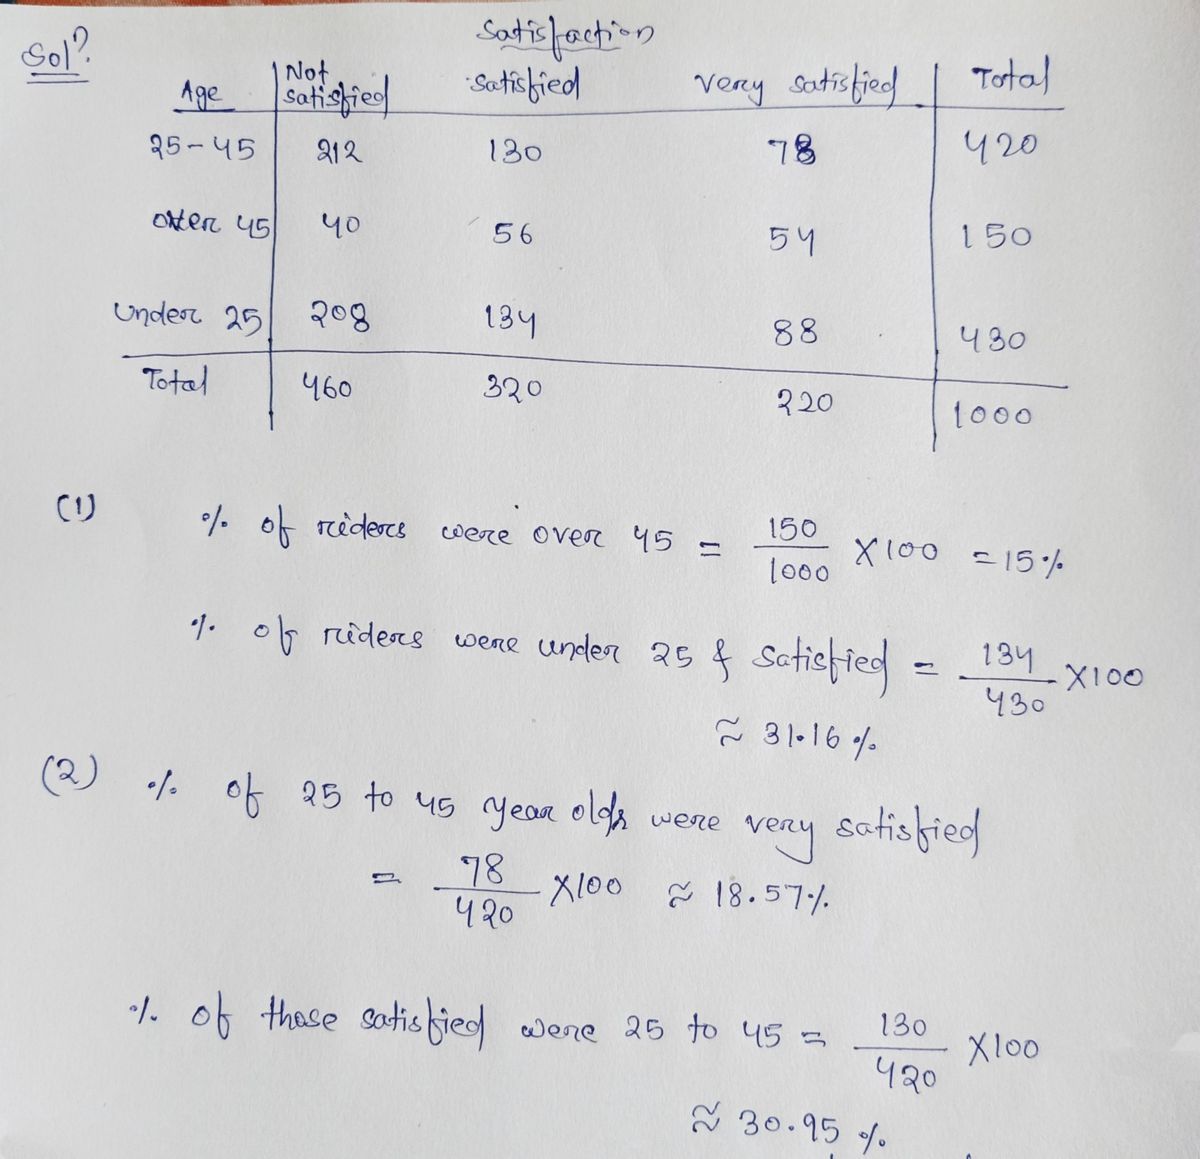
A survey of satisfaction amongst a random sample of TTC riders was conducted. The contingency table summarizes responses of satisfaction and age. age Not Satis 25-45 Over 45 Under 25 Total 212 208 satisfaction Satisfied Very Sati 130 56 134 320 78 54 66 Total 150 430 1,000 1. What percentage of riders were over 45? What percentage of riders were under 25 and satisfied? 2. What percentage of 25 to 45 year olds were very satisfied? What percentage of those satisfied were 25 to 457 3. What is the marginal relative frequency distribution of satisfaction? (hint: you don't need to draw it) 4. Using the conditional relative frequency of satisfaction indicate if satisfaction is independent of age (hint: you don't need to draw it)
A survey of satisfaction amongst a random sample of TTC riders was conducted. The contingency table summarizes responses of satisfaction and age. age Not Satis 25-45 Over 45 Under 25 Total 212 208 satisfaction Satisfied Very Sati 130 56 134 320 78 54 66 Total 150 430 1,000 1. What percentage of riders were over 45? What percentage of riders were under 25 and satisfied? 2. What percentage of 25 to 45 year olds were very satisfied? What percentage of those satisfied were 25 to 457 3. What is the marginal relative frequency distribution of satisfaction? (hint: you don't need to draw it) 4. Using the conditional relative frequency of satisfaction indicate if satisfaction is independent of age (hint: you don't need to draw it)

Glencoe Algebra 1, Student Edition, 9780079039897, 0079039898, 2018
18th Edition
ISBN:9780079039897
Author:Carter
Publisher:Carter
Chapter10: Statistics
Section10.6: Summarizing Categorical Data
Problem 30PPS

Related questions
Question

Transcribed Image Text:A survey of satisfaction amongst a random sample of TTC riders was conducted. The contingency table
summarizes responses of satisfaction and age.
age Not Satis
25-45
Over 45
Under 25
Total
212
208
satisfaction
Satisfied Very Sati
130
56
134
320
78
54
66
Total
150
430
1,000
1. What percentage of riders were over 45? What percentage of riders were under 25 and satisfied?
2. What percentage of 25 to 45 year olds were very satisfied? What percentage of those satisfied were 25
to 457
3. What is the marginal relative frequency distribution of satisfaction? (hint: you don't need to draw it)
4. Using the conditional relative frequency of satisfaction indicate if satisfaction is independent of age
(hint: you don't need to draw it)
Expert Solution
Step 1: Determining the solution.

Step by step
Solved in 3 steps with 2 images

Recommended textbooks for you
Glencoe Algebra 1, Student Edition, 9780079039897…
Algebra
ISBN:
9780079039897
Author:
Carter
Publisher:
McGraw Hill

Holt Mcdougal Larson Pre-algebra: Student Edition…
Algebra
ISBN:
9780547587776
Author:
HOLT MCDOUGAL
Publisher:
HOLT MCDOUGAL

College Algebra (MindTap Course List)
Algebra
ISBN:
9781305652231
Author:
R. David Gustafson, Jeff Hughes
Publisher:
Cengage Learning
Glencoe Algebra 1, Student Edition, 9780079039897…
Algebra
ISBN:
9780079039897
Author:
Carter
Publisher:
McGraw Hill
Holt Mcdougal Larson Pre-algebra: Student Edition…
Algebra
ISBN:
9780547587776
Author:
HOLT MCDOUGAL
Publisher:
HOLT MCDOUGAL
College Algebra (MindTap Course List)
Algebra
ISBN:
9781305652231
Author:
R. David Gustafson, Jeff Hughes
Publisher:
Cengage Learning
