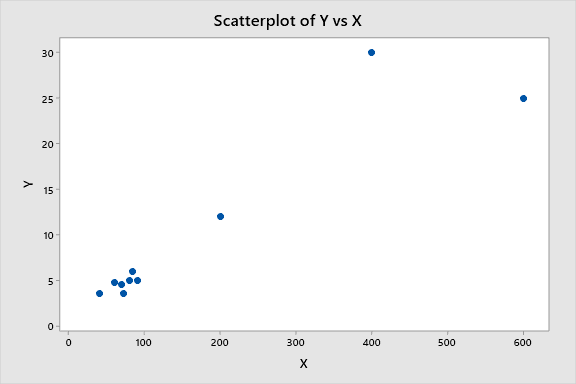
A study is made of the relationship between annual production volume of Good A and factory floor area. Table below shows the data from a sample of 10 factories. Factory Factory floor area, X (‘000m2 ) Annual production volume, Y ($‘ 000) 1 40 3.5 2 600 25.0 3 60 4.8 4 72 3.5 5 400 30.0 6 90 5.0 7 200 12.0 8 70 4.5 9 80 5.0 10 84 6.0 Construct a scatter plot. Find the regression model for predicting the annual production volume. Interpret the meaning of the slope in this question. Predict the average annual production volume for a floor area of 450,000 m2.


Correlation
Correlation defines a relationship between two independent variables. It tells the degree to which variables move in relation to each other. When two sets of data are related to each other, there is a correlation between them.
Linear Correlation
A correlation is used to determine the relationships between numerical and categorical variables. In other words, it is an indicator of how things are connected to one another. The correlation analysis is the study of how variables are related.
Regression Analysis
Regression analysis is a statistical method in which it estimates the relationship between a dependent variable and one or more independent variable. In simple terms dependent variable is called as outcome variable and independent variable is called as predictors. Regression analysis is one of the methods to find the trends in data. The independent variable used in Regression analysis is named Predictor variable. It offers data of an associated dependent variable regarding a particular outcome.
A study is made of the relationship between annual production volume of Good A and factory floor area. Table below shows the data from a sample of 10 factories.
|
Factory |
Factory floor area, X (‘000m2 ) |
Annual production volume, Y ($‘ 000) |
|
1 |
40 |
3.5 |
|
2 |
600 |
25.0 |
|
3 |
60 |
4.8 |
|
4 |
72 |
3.5 |
|
5 |
400 |
30.0 |
|
6 |
90 |
5.0 |
|
7 |
200 |
12.0 |
|
8 |
70 |
4.5 |
|
9 |
80 |
5.0 |
|
10 |
84 |
6.0 |
Construct a
The given information represents the factory floor area and their annual production volume of 10 factories.
Scatterplot:
Construct the scatter plot for the given data is as follows:

Step by step
Solved in 4 steps with 7 images


