a socialogist expects the life expenancy of people in africa is different than the life expantancy of people in asia. the data shown in the table below. determine the 95% confidence interval for the difference in the population mean africa asia mean1= 63.3 yr mean2= 65.2 STD1= 9.1 yr STD2= 7.3 yr n1=120 n2= 150 calculate the critical value. use σ=0.05 A) -11.4 < μ1 - μ2 < -7.6 B)-12.2< μ1 - μ2 < -6.9 C). -13.5< μ1 - μ2 < -6.3
a socialogist expects the life expenancy of people in africa is different than the life expantancy of people in asia. the data shown in the table below. determine the 95% confidence interval for the difference in the population mean africa asia mean1= 63.3 yr mean2= 65.2 STD1= 9.1 yr STD2= 7.3 yr n1=120 n2= 150 calculate the critical value. use σ=0.05 A) -11.4 < μ1 - μ2 < -7.6 B)-12.2< μ1 - μ2 < -6.9 C). -13.5< μ1 - μ2 < -6.3

MATLAB: An Introduction with Applications
6th Edition
ISBN:9781119256830
Author:Amos Gilat
Publisher:Amos Gilat
Chapter1: Starting With Matlab
Section: Chapter Questions
Problem 1P

Related questions
Topic Video
Question
a socialogist expects the life expenancy of people in africa is different than the life expantancy of people in asia. the data shown in the table below. determine the 95% confidence interval for the difference in the population
| africa | asia |
| mean1= 63.3 yr | mean2= 65.2 |
| STD1= 9.1 yr | STD2= 7.3 yr |
| n1=120 | n2= 150 |
calculate the critical value. use σ=0.05
A) -11.4 < μ1 - μ2 < -7.6 B)-12.2< μ1 - μ2 < -6.9 C). -13.5< μ1 - μ2 < -6.3
Expert Solution
Step 1
Step-by-step procedure to obtain the value of using STATKEY:
- Choose Normal under Theoretical Distributions.
- In Normal Distribution, click Edit Parameters.
- Enter mean as 0 and standard deviation as 1 and click Ok.
- Click Two-Tail.
- Click OK.
Output obtained using the MINITAB software is given below:
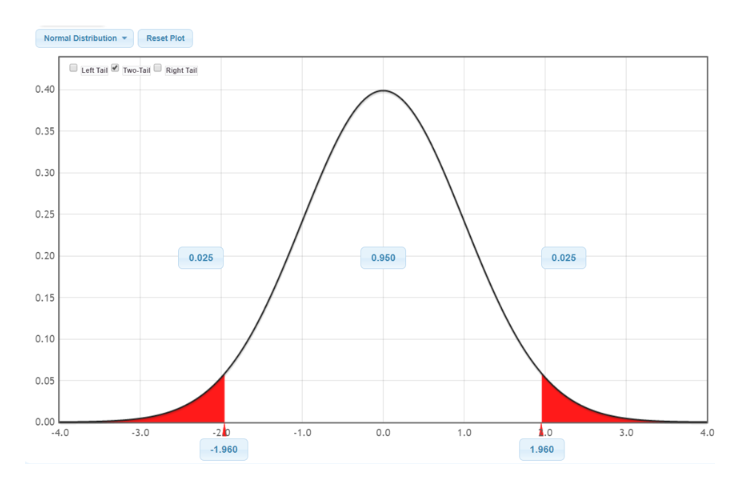
Step 2
From the output, the value of is 1.96 for 95% confidence.
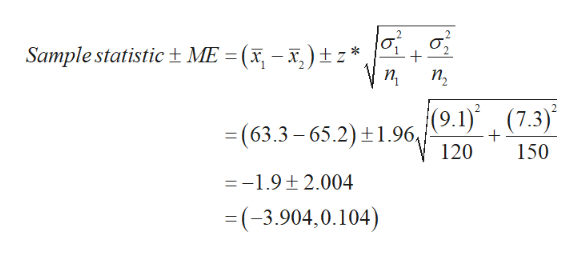
The 95% confidence interval is obtained as follows:

Step by step
Solved in 3 steps with 2 images

Knowledge Booster


Learn more about
Need a deep-dive on the concept behind this application? Look no further. Learn more about this topic, statistics and related others by exploring similar questions and additional content below.Similar questions
Recommended textbooks for you
MATLAB: An Introduction with Applications
Statistics
ISBN:
9781119256830
Author:
Amos Gilat
Publisher:
John Wiley & Sons Inc

Probability and Statistics for Engineering and th…
Statistics
ISBN:
9781305251809
Author:
Jay L. Devore
Publisher:
Cengage Learning

Statistics for The Behavioral Sciences (MindTap C…
Statistics
ISBN:
9781305504912
Author:
Frederick J Gravetter, Larry B. Wallnau
Publisher:
Cengage Learning
MATLAB: An Introduction with Applications
Statistics
ISBN:
9781119256830
Author:
Amos Gilat
Publisher:
John Wiley & Sons Inc
Probability and Statistics for Engineering and th…
Statistics
ISBN:
9781305251809
Author:
Jay L. Devore
Publisher:
Cengage Learning
Statistics for The Behavioral Sciences (MindTap C…
Statistics
ISBN:
9781305504912
Author:
Frederick J Gravetter, Larry B. Wallnau
Publisher:
Cengage Learning

Elementary Statistics: Picturing the World (7th E…
Statistics
ISBN:
9780134683416
Author:
Ron Larson, Betsy Farber
Publisher:
PEARSON

The Basic Practice of Statistics
Statistics
ISBN:
9781319042578
Author:
David S. Moore, William I. Notz, Michael A. Fligner
Publisher:
W. H. Freeman

Introduction to the Practice of Statistics
Statistics
ISBN:
9781319013387
Author:
David S. Moore, George P. McCabe, Bruce A. Craig
Publisher:
W. H. Freeman