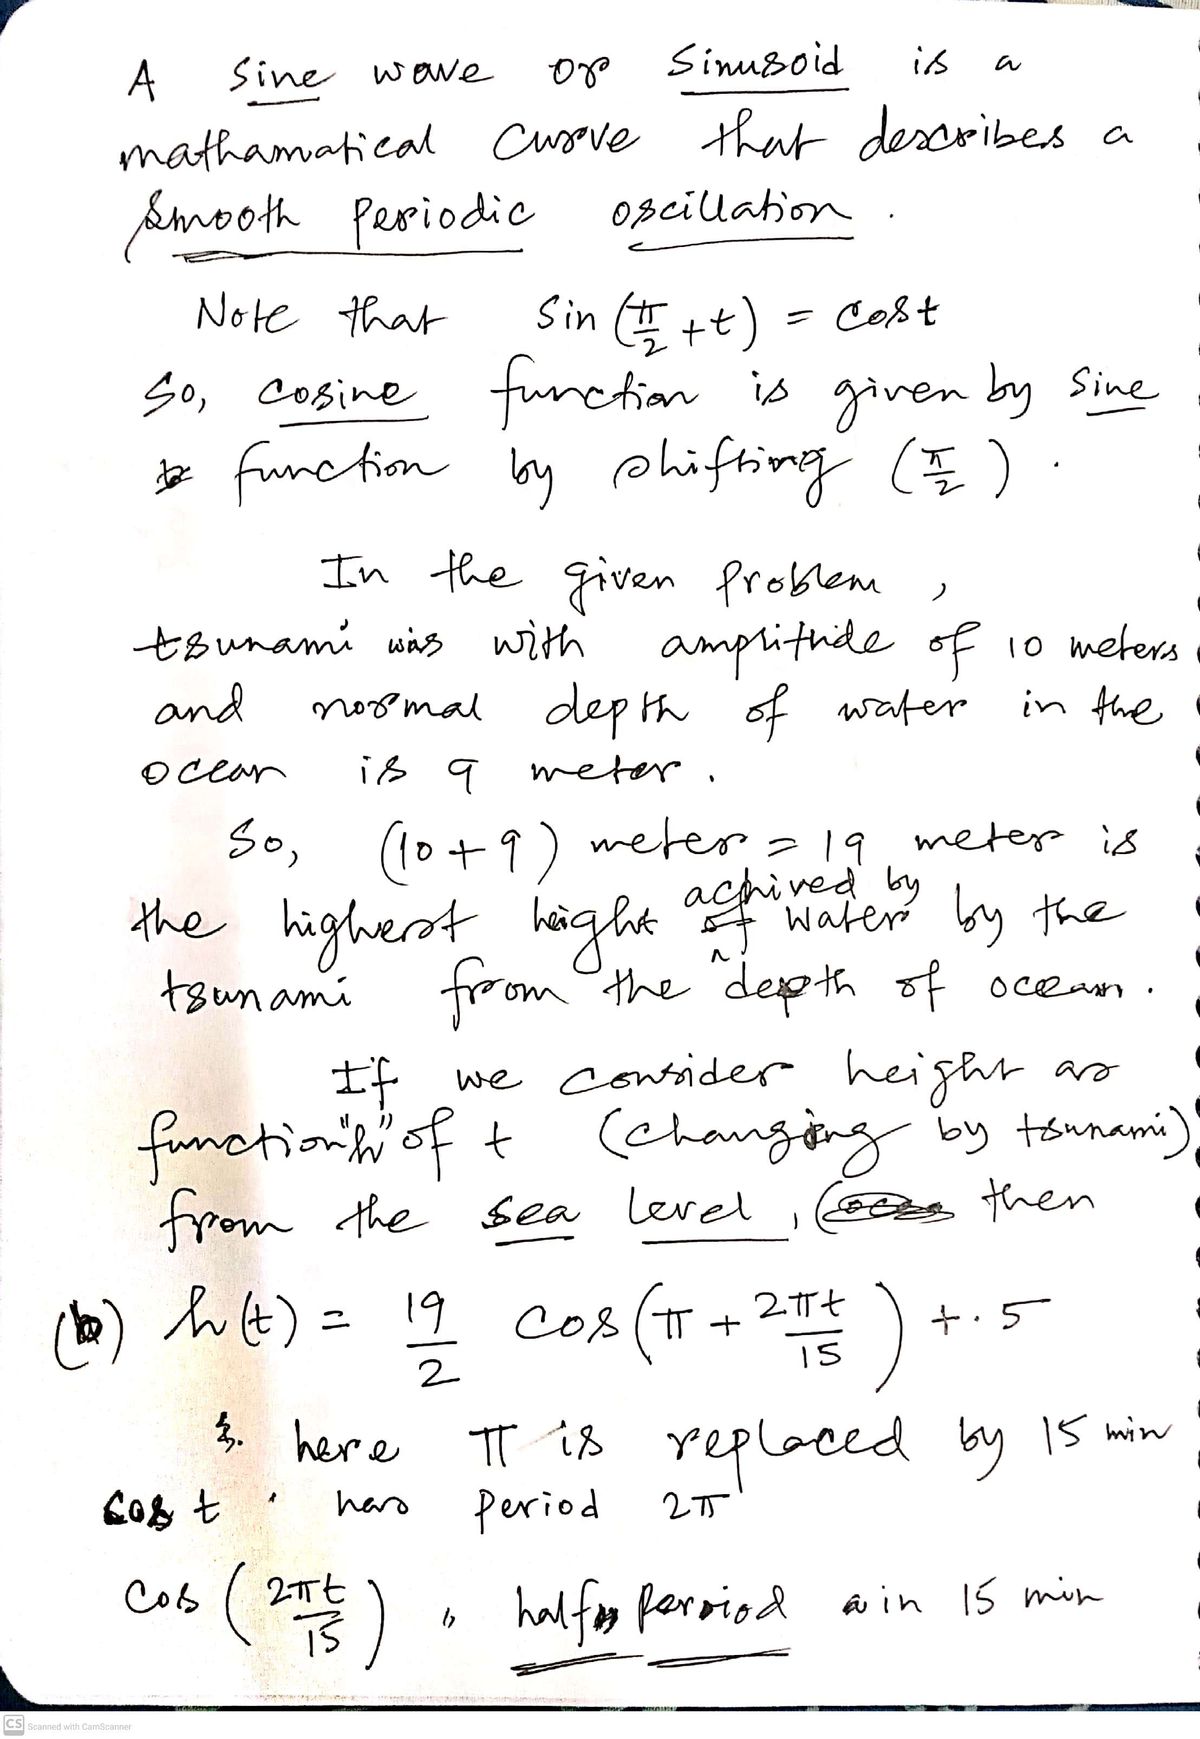
a) Sketch the graph of the water depths from 0 to 15 minutes. b) Find a particular equation expressing water depth as a function of time. c) What does a negative water depth mean (keeping in mind that there can’t be less than zero water)
Contingency Table
A contingency table can be defined as the visual representation of the relationship between two or more categorical variables that can be evaluated and registered. It is a categorical version of the scatterplot, which is used to investigate the linear relationship between two variables. A contingency table is indeed a type of frequency distribution table that displays two variables at the same time.
Binomial Distribution
Binomial is an algebraic expression of the sum or the difference of two terms. Before knowing about binomial distribution, we must know about the binomial theorem.
A tsunami (sometimes inaccurately called a “tidal wave”) is a fast moving ocean wave caused by an underwater earthquake. The water first goes down from its normal level to its lowest level, then rises to its highest level above normal. The time it takes to go from lowest level to highest level, and back to lowest level is 15 minutes. The tidal wave continues this pattern until it crashes onto shore. Suppose a tsunami with amplitude of
10 meters approaches Honolulu, HI where the normal depth of water is 9
meters. Assume the tsunami varies in depth of water sinusoidally with time as it approaches the pier.
a) Sketch the graph of the water depths from 0 to 15 minutes.
b) Find a particular equation expressing water depth as a function of time.
c) What does a negative water depth mean (keeping in mind that there can’t be less than zero water)?

Trending now
This is a popular solution!
Step by step
Solved in 2 steps with 2 images


