A sample of blood pressure measurements is taken for a group of adults, and those values (mm Hg) are listed below. The values are matched so that 10 subjects each have a systolic and diastolic measurement. Find the coefficient of variation for each of the two samples; then compare the variation. Systolic 120 129 158 96 156 123 115 135 125 118 Diastolic 82 75 72 52 89 89 60 64 70 80 The coefficient of variation for the systolic measurements is% (Type an integer or decimal rounded to one decimal place as needed.) The coefficient of variation for the diastolic measurements is %. (Type an integer or decimal rounded to one decimal place as needed) Compare the variation. The coefficients of variation for each data set are CIB Therefore, the systolic measurements vary the diastolic measurements. about the same as significantly more than significantly less than
A sample of blood pressure measurements is taken for a group of adults, and those values (mm Hg) are listed below. The values are matched so that 10 subjects each have a systolic and diastolic measurement. Find the coefficient of variation for each of the two samples; then compare the variation. Systolic 120 129 158 96 156 123 115 135 125 118 Diastolic 82 75 72 52 89 89 60 64 70 80 The coefficient of variation for the systolic measurements is% (Type an integer or decimal rounded to one decimal place as needed.) The coefficient of variation for the diastolic measurements is %. (Type an integer or decimal rounded to one decimal place as needed) Compare the variation. The coefficients of variation for each data set are CIB Therefore, the systolic measurements vary the diastolic measurements. about the same as significantly more than significantly less than

MATLAB: An Introduction with Applications
6th Edition
ISBN:9781119256830
Author:Amos Gilat
Publisher:Amos Gilat
Chapter1: Starting With Matlab
Section: Chapter Questions
Problem 1P

Related questions
Question
Question5

Transcribed Image Text:**Blood Pressure Variation Analysis**
A sample of blood pressure measurements is taken for a group of adults, with values (mm Hg) matched for 10 subjects, each having systolic and diastolic measurements. The goal is to calculate the coefficient of variation for both and compare the results.
- **Systolic Measurements:** 120, 129, 158, 96, 123, 115, 135, 125, 118
- **Diastolic Measurements:** 82, 75, 72, 52, 89, 99, 60, 74, 70, 80
**Calculation Steps:**
1. **Coefficient of Variation for Systolic Measurements:**
- The user is required to input the calculated percentage.
- Prompt: "Type an integer or decimal rounded to one decimal place as needed."
2. **Coefficient of Variation for Diastolic Measurements:**
- The user is required to input the calculated percentage.
- Prompt: "Type an integer or decimal rounded to one decimal place as needed."
3. **Comparison of Variation:**
- Users can select one of the following comparisons for the systolic vs. diastolic variation:
- about the same as
- significantly more than
- significantly less than
**Interactive Element:** A drop-down menu allows users to choose how the systolic measurements vary compared to the diastolic measurements.
**Note:** Accurate calculation and selection based on the coefficients of variation are crucial for understanding blood pressure variability.
Expert Solution
Step 1
Use EXCEL Procedure for finding the values of systolic and Diastolic.
Follow the instruction to obtain the values of mean and SD:
- Open EXCEL
- Go to Data>Data Analysis.
- Choose Descriptive Statistics.
- Enter the input range as $A$1:$A$11.
- Check the Labels in the first row.
- Check the option Summary statistics
- Click OK.
EXCEL output:
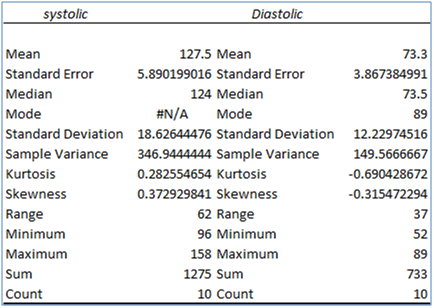
From the EXCEL output,
The values of mean and SD for systolic is,
The value of Mean is 127.5
The value of standard deviation is 18.6264

Step by step
Solved in 2 steps with 3 images

Recommended textbooks for you
MATLAB: An Introduction with Applications
Statistics
ISBN:
9781119256830
Author:
Amos Gilat
Publisher:
John Wiley & Sons Inc

Probability and Statistics for Engineering and th…
Statistics
ISBN:
9781305251809
Author:
Jay L. Devore
Publisher:
Cengage Learning

Statistics for The Behavioral Sciences (MindTap C…
Statistics
ISBN:
9781305504912
Author:
Frederick J Gravetter, Larry B. Wallnau
Publisher:
Cengage Learning
MATLAB: An Introduction with Applications
Statistics
ISBN:
9781119256830
Author:
Amos Gilat
Publisher:
John Wiley & Sons Inc
Probability and Statistics for Engineering and th…
Statistics
ISBN:
9781305251809
Author:
Jay L. Devore
Publisher:
Cengage Learning
Statistics for The Behavioral Sciences (MindTap C…
Statistics
ISBN:
9781305504912
Author:
Frederick J Gravetter, Larry B. Wallnau
Publisher:
Cengage Learning

Elementary Statistics: Picturing the World (7th E…
Statistics
ISBN:
9780134683416
Author:
Ron Larson, Betsy Farber
Publisher:
PEARSON

The Basic Practice of Statistics
Statistics
ISBN:
9781319042578
Author:
David S. Moore, William I. Notz, Michael A. Fligner
Publisher:
W. H. Freeman

Introduction to the Practice of Statistics
Statistics
ISBN:
9781319013387
Author:
David S. Moore, George P. McCabe, Bruce A. Craig
Publisher:
W. H. Freeman