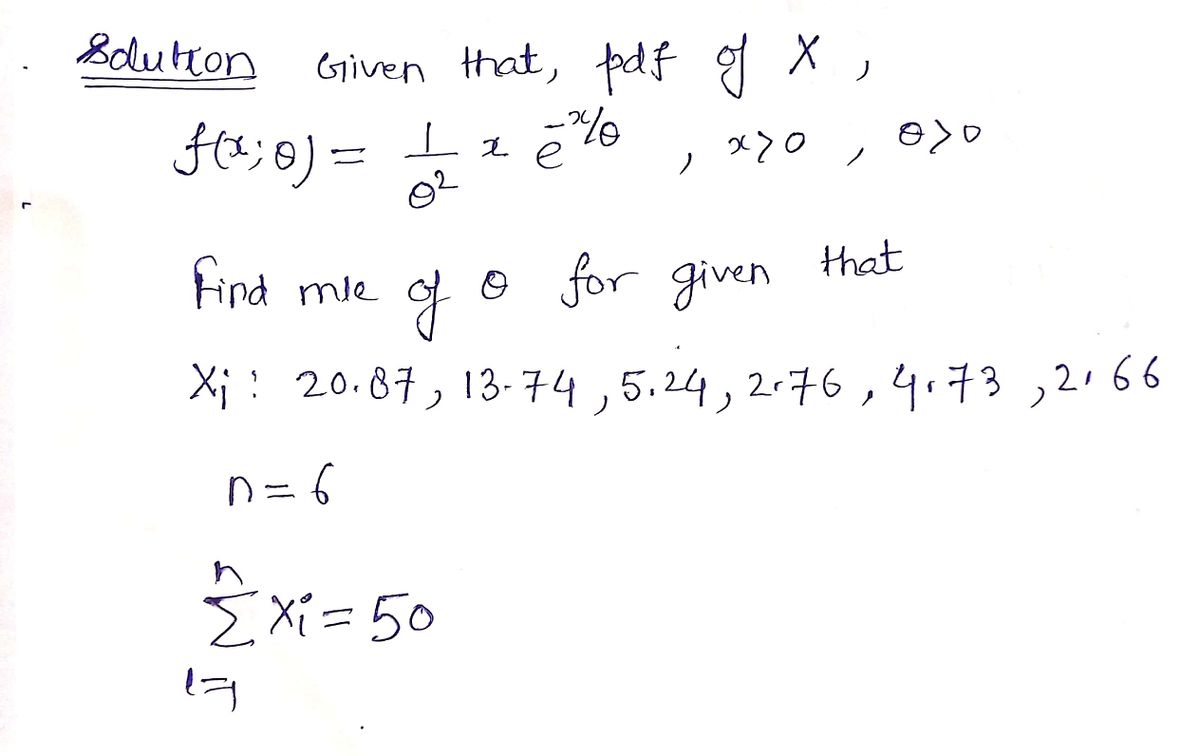
A sample consisting of the values 20.87, 13.74, 5.24, 2.76, 4.73, 2.66 is known to come from a population with the following density function. (image) Find the maximum likelihood estimate of ?.


Q: Use a t-distribution to answer this question. Assume the samples are random samples from…
A: From the given information,Cumulative tail area (rejection area) = 0.05.Sample size of first sample…
Q: 1. Suppose we have a six-sided die that we roll once. Let ai represent the event that the result is…
A:
Q: E. A coin is tossed 400 times. Find the probability of obtaining a) exactly 205 heads. b) less than…
A:
Q: Use a t-distribution to answer this question. Assume the samples are random samples from…
A: We have to find degrees of freedom and critical value..
Q: Assume that a randomly selected subject is given a bone density test. Those test scores are normally…
A: A randomly selected subject is given a bone density test and the test scores are normally…
Q: Assume that a randomly selected subject is given a bone density test. Those test scores are normally…
A: Given Those test scores are normally distributed with a mean of 0 and a standard deviation of 1.
Q: Cigarette Smoking A researcher found that a cigarette smoker smokes on average 29 cigarettes a day.…
A: Answer: From the given data, Sample size (n) = 12 Sample mean x¯ = 30 Sample standard deviation (s)…
Q: Part 4 (c) Find the standardized test statistic, t. The standardized test statistic is t=enter…
A: The sample size is 16, population mean is $97,000.
Q: The bivariate table above shows whether or not a random sample of 300 parents planned to have their…
A: Here we need to find the appropriate measure of association using the given value of the chi-square.…
Q: Find the F-test statistic to test the claim that the population variances are equal. Both…
A: From the provided information,Claim : Population variances are equal Both distribution are…
Q: A baseball team claims that the mean length of its games is at least 2.7 hours. State Ho and H, in…
A: The baseball team claims that the mean length of its games is at least 2.7 hours.
Q: You receive a brochure from a large university. The brochure indicates that the mean class size for…
A: Introduction: Denote μ as the true mean class size for full-time faculty.
Q: p-value IS less lan 0.003. c) Accept Ho because the p-value is less than 0.05. d) Fail to accept Ho…
A: Option a) -2.24 Explanation: According to the given question, mean annual salary is $ 30000. To test…
Q: The amount of time it takes a manager named Leila to complete an employee review is normally…
A: We are given the amount of time it takes for a manager to review an employee, the mean is 46 minutes…
Q: Customers can replace 1, 2, 3, or 4 tires at a time for their vehicle at Thrifty Tires, a nationwide…
A: Given Mean=3.33 Standard deviations=0.71 n=6
Q: You receive a brochure from a large university. The brochure indicates that the mean class size for…
A: We have given that Sample size n =18 Population mean =33 Level of significance α=0.10
Q: rats take more time on average than hamsters to travel through a maze? The table below shows the…
A:
Q: An employment information service claims the mean annual salary for senior level product engineers…
A: The mean difference between the population and sample for sample size less than 30 are tested using…
Q: An employment information service claims the mean annual salary for senior level product engineers…
A: Let μ be the population mean annual salary for senior level product engineers. The claim is that the…
Q: Use a t-distribution to answer this question. Assume the samples are random samples from…
A: Given data α=2.5%n1=17 n2=20
Q: You receive a brochure from a large university. The brochure indicates that the mean class size for…
A:
Q: In each of Exercises, suppose that you want to perform a hypothesis test for a population mean.…
A: For testing population mean:If sample size is small and the population is normally distributed then…
Q: Assume that a randomly selected subject is given a bone density test. Those test scores are normally…
A: Obtain the probability that a given score is less than z = –0.55. The probability that a given score…
Q: Assume the data have a normal distribution. Find the critical z value(s) used to test the null…
A:
Q: Given a random sample of size n from a normal opulation with the known mean u, find the maximum…
A: In this problem, we're tasked with finding the Maximum Likelihood Estimator (MLE) for the standard…
Q: An employment information service claims the mean annual salary for senior level product engineers…
A: Given that Sample size n =16 Level of significance =alpha =0.01 NOTE:- According to bartleby…
Q: Three cylindrical parts are joined end to end to make up a shaft in a machine; 2 type A parts and 1…
A: A continuous random variable X is said to follow Normal distribution with parameters μ and σ2 if its…
Q: A spinner contains the values 0 up to, but not including, 1. The outcomes of the spinner are equally…
A: given data uniform distribution between 0 and 1 X~U(0,1) we have to find mean and median of data.
Q: Assume that a randomly selected subject is given a bone density test. Those test scores are normally…
A: Let us consider the test score to be denoted by Z and it is given that the test scores are normally…
Q: The weekly demand of a slow-moving product has the probability mass function shown to the right.…
A: Obtain the expected value of weekly demand. The expected value of weekly demand is obtained below as…
Q: data given below represent the number of males and females in a work group who feel overstressed and…
A: By applying the chi-square test for independence,Observed frequency (O)…
Q: Provide the general form of the likelihood function used in parameter estimation. What is meant by…
A: The provided information is as follows:The objective is to determine the general form of the…
A sample consisting of the values 20.87, 13.74, 5.24, 2.76, 4.73, 2.66 is known to come from a population with the following density
Find the maximum likelihood estimate of ?.


Step by step
Solved in 2 steps with 2 images

- An employment information service claims the mean annual salary for senior level product engineers is $97,000. The annual salaries (in dollars) for a random sample of 16 senior level product engineers are shown in the table to the right. At α=0.10, test the claim that the mean salary is $97,000. Complete parts (a) through (e) below. Assume the population is normally distributed. Annual Salaries 100 ,637 96 ,395 93 ,509 112 ,609 82 ,472 74 ,162 76 ,989 80 ,977 102 ,467 76 ,251 103 ,944 104 ,042 91 ,135 82 ,152 85 ,096 110 ,269 Part 1 (a) Identify the claim and state H0 and Ha. (Type integers or decimals.) Part 2 (b) Use technology to find the critical value(s) and identify the rejection region(s). The critical value(s) is/are t0= (c) Find the standardized test statistic, t. The standardized test…Find the F-test statistic to test the claim that the variances of the two populations are equal. Both distributions are normal. The populations are independent. The standard deviation of the first sample is 6.5752 7.3865 is the standard deviation of the second sample.A company wants to determine whether it's consumer product ratings (0-10) have changed from last year to this year. The table below shows the company's product ratings from 8 consumers for last year and this year. At a=0.05, is there enough evidence to conclude that the ratings have changed? Assume the samples are random and dependent, and the population is normally distributed. Complete parts A-F.
- The cross-tabulation data given below represent the number of males and females in a work group who feel overstressed and those who don't. Complete parts a through d below. Overstressed? Female Male No Yes 10 6 5 11 a. Write the hypotheses for the chi-square test for independence. Ho gender and overstress are independent H₁ gender and overstress are dependent b. Find the expected frequencies. Overstressed? Female Male Grand Total No 7.5 7.5 15 Yes 8.5 8.5 17 Grand Total 16 16 32 (Type integers or decimals rounded to two decimal places as needed.) c. Compute the chi-square statistic 3.14 (Type an integer or decimal rounded to two decimal places as needed.) d. Find the chi-square critical value and p-value and draw a conclusion using a level of significance of 0.05. Find the chi-square critical value (Round to three decimal places as needed.) adDetermine the rejection region for a hypothesis test for the population mean using the give information. Assume that the population standard deviation is unknown, the sample size is small, and the population distribution is approximately normal. Write your answer in a format exactly as in the following examples, "t <= -2.203", or "t >= 1.706", or "|t| >= 1.305". Do not forget the SPACE after t and the SPACE before the number. Also make sure to enter the digit 0 before the decimal point. ?=0.90,??=18 two-tailed test Reject H0 ifA random sample of size 10 yielded roughly "mound-shaped" data with a sample mean of 63.5 and a sample variance of 60.8. Let (L, OU) be the interval estimate that contains the population mean with 95% probability. Find the width of the interval. That is, find 0 – 0₁. 4.52 5.49 5.58 5.70 9.04 10.99 11.16 11.40 none of the other answers give the correct width
