A restaurant manager is interested in investigating whether the main course ordered and the dessert ordered are related. The table below shows the results of a survey. Frequencies of Food Preference and Dessert Types Fish Meat Vegetarian 82 89 18 Cake
A restaurant manager is interested in investigating whether the main course ordered and the dessert ordered are related. The table below shows the results of a survey. Frequencies of Food Preference and Dessert Types Fish Meat Vegetarian 82 89 18 Cake
MATLAB: An Introduction with Applications
6th Edition
ISBN:9781119256830
Author:Amos Gilat
Publisher:Amos Gilat
Chapter1: Starting With Matlab
Section: Chapter Questions
Problem 1P
Related questions
Question
need C and D please

Transcribed Image Text:A restaurant manager is interested in investigating whether the main course ordered and the dessert
ordered are related. The table below shows the results of a survey.
Frequencies of Food Preference and
Dessert Types
Fish Meat Vegetarian
83
89
48
114
60
43
Cake
Ice Cream 63
Pie
108 108
What can be concluded at the α = 0.01 significance level?
a. What is the correct statistical test to use?
O Paired t-test
Independence
Goodness-of-Fit
Homogeneity
b. What are the null and alternative hypotheses?
Ho:
O Main course and dessert are independent.
The distribution of dessert orders is the same for each main course that is ordered.
The distribution of dessert orders is not the same for each main course that is ordered.
O Main course and dessert are dependent.
H₁:
Main course and dessert are independent.
The distribution of dessert orders is not the same for each main course that is ordered.
Main course and dessert are dependent.
The distribution of dessert orders is the same for each main course that is ordered.
c. The test-statistic for this data =
(Please show your answer to three decimal places.)
d. The p-value for this sample
=
(Please show your answer to four decimal places.)
Expert Solution
This question has been solved!
Explore an expertly crafted, step-by-step solution for a thorough understanding of key concepts.
This is a popular solution!
Trending now
This is a popular solution!
Step by step
Solved in 3 steps with 14 images

Follow-up Questions
Read through expert solutions to related follow-up questions below.
Follow-up Question
need help with part C please.

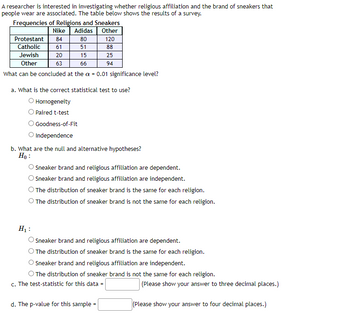
Transcribed Image Text:A researcher is interested in investigating whether religious affiliation and the brand of sneakers that
people wear are associated. The table below shows the results of a survey.
Frequencies of Religions and Sneakers
Nike Adidas
Other
80
120
51
88
Jewish
15
25
Other
66
94
What can be concluded at the a = 0.01 significance level?
Protestant 84
Catholic 61
20
63
a. What is the correct statistical test to use?
Homogeneity
O Paired t-test
Goodness-of-Fit
O Independence
b. What are the null and alternative hypotheses?
Ho:
O Sneaker brand and religious affiliation are dependent.
Sneaker brand and religious affiliation are independent.
The distribution of sneaker brand is the same for each religion.
O The distribution of sneaker brand is not the same for each religion.
H₁:
Sneaker brand and religious affiliation are dependent.
O The distribution of sneaker brand is the same for each religion.
O Sneaker brand and religious affiliation are independent.
O The distribution of sneaker brand is not the same for each religion.
c. The test-statistic for this data =
d. The p-value for this sample
(Please show your answer to three decimal places.)
(Please show your answer to four decimal places.)
Solution
Recommended textbooks for you

MATLAB: An Introduction with Applications
Statistics
ISBN:
9781119256830
Author:
Amos Gilat
Publisher:
John Wiley & Sons Inc

Probability and Statistics for Engineering and th…
Statistics
ISBN:
9781305251809
Author:
Jay L. Devore
Publisher:
Cengage Learning

Statistics for The Behavioral Sciences (MindTap C…
Statistics
ISBN:
9781305504912
Author:
Frederick J Gravetter, Larry B. Wallnau
Publisher:
Cengage Learning

MATLAB: An Introduction with Applications
Statistics
ISBN:
9781119256830
Author:
Amos Gilat
Publisher:
John Wiley & Sons Inc

Probability and Statistics for Engineering and th…
Statistics
ISBN:
9781305251809
Author:
Jay L. Devore
Publisher:
Cengage Learning

Statistics for The Behavioral Sciences (MindTap C…
Statistics
ISBN:
9781305504912
Author:
Frederick J Gravetter, Larry B. Wallnau
Publisher:
Cengage Learning

Elementary Statistics: Picturing the World (7th E…
Statistics
ISBN:
9780134683416
Author:
Ron Larson, Betsy Farber
Publisher:
PEARSON

The Basic Practice of Statistics
Statistics
ISBN:
9781319042578
Author:
David S. Moore, William I. Notz, Michael A. Fligner
Publisher:
W. H. Freeman

Introduction to the Practice of Statistics
Statistics
ISBN:
9781319013387
Author:
David S. Moore, George P. McCabe, Bruce A. Craig
Publisher:
W. H. Freeman