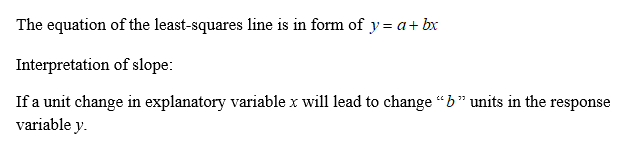
A researcher wishes to examine the relationship between number of words a child speaks at age two and their score on the SATS 15 years later. The researcher discovers a linear relationship between the data sets, and the least squares line is: ý = 94+ 153x where x is the number of words a child speaks at age two and y is their score on the SATS 15 years later. The slope of the regression line can be interpreted in the following way: When amount of words spoken at two increases by one word, the SAT score tends to decrease by 153. OWhen amount of words spoken at two increases by one word, the SAT score tends to increase by 153. O When amount of words spoken at two increases by one word, the SAT score tends to decrease by 94. O When amount of words spoken at two increases by one word, the SAT score tends to increase by 94.
A researcher wishes to examine the relationship between number of words a child speaks at age two and their score on the SATS 15 years later. The researcher discovers a linear relationship between the data sets, and the least squares line is: ý = 94+ 153x where x is the number of words a child speaks at age two and y is their score on the SATS 15 years later. The slope of the regression line can be interpreted in the following way: When amount of words spoken at two increases by one word, the SAT score tends to decrease by 153. OWhen amount of words spoken at two increases by one word, the SAT score tends to increase by 153. O When amount of words spoken at two increases by one word, the SAT score tends to decrease by 94. O When amount of words spoken at two increases by one word, the SAT score tends to increase by 94.

MATLAB: An Introduction with Applications
6th Edition
ISBN:9781119256830
Author:Amos Gilat
Publisher:Amos Gilat
Chapter1: Starting With Matlab
Section: Chapter Questions
Problem 1P

Related questions
Question
Is this correct?

Transcribed Image Text:A researcher wishes to examine the relationship between number of words a child speaks at age two and
their score on the SATS 15 years later. The researcher discovers a linear relationship between the data sets,
and the least squares line is: ŷ = 94 + 153x where x is the number of words a child speaks at age two
and y is their score on the SATS 15 years later. The slope of the regression line can be interpreted in the
following way:
O When amount of words spoken at two increases by one word, the SAT score tends to decrease by 153.
O When amount of words spoken at two increases by one word, the SAT score tends to increase by 153.
OWhen amount of words spoken at two increases by one word, the SAT score tends to decrease by 94.
When amount of words spoken at two increases by one word, the SAT score tends to increase by 94.
Expert Solution
Step 1

Trending now
This is a popular solution!

Step by step
Solved in 2 steps with 2 images

Knowledge Booster


Learn more about
Need a deep-dive on the concept behind this application? Look no further. Learn more about this topic, statistics and related others by exploring similar questions and additional content below.Recommended textbooks for you
MATLAB: An Introduction with Applications
Statistics
ISBN:
9781119256830
Author:
Amos Gilat
Publisher:
John Wiley & Sons Inc

Probability and Statistics for Engineering and th…
Statistics
ISBN:
9781305251809
Author:
Jay L. Devore
Publisher:
Cengage Learning

Statistics for The Behavioral Sciences (MindTap C…
Statistics
ISBN:
9781305504912
Author:
Frederick J Gravetter, Larry B. Wallnau
Publisher:
Cengage Learning
MATLAB: An Introduction with Applications
Statistics
ISBN:
9781119256830
Author:
Amos Gilat
Publisher:
John Wiley & Sons Inc
Probability and Statistics for Engineering and th…
Statistics
ISBN:
9781305251809
Author:
Jay L. Devore
Publisher:
Cengage Learning
Statistics for The Behavioral Sciences (MindTap C…
Statistics
ISBN:
9781305504912
Author:
Frederick J Gravetter, Larry B. Wallnau
Publisher:
Cengage Learning

Elementary Statistics: Picturing the World (7th E…
Statistics
ISBN:
9780134683416
Author:
Ron Larson, Betsy Farber
Publisher:
PEARSON

The Basic Practice of Statistics
Statistics
ISBN:
9781319042578
Author:
David S. Moore, William I. Notz, Michael A. Fligner
Publisher:
W. H. Freeman

Introduction to the Practice of Statistics
Statistics
ISBN:
9781319013387
Author:
David S. Moore, George P. McCabe, Bruce A. Craig
Publisher:
W. H. Freeman